Jan 29, 2015
Robert.Boston I'm certainly hoping so! My portfolio is set up for a solid bump at the Q4 ER.�
Jan 30, 2015
mejojo +1
I certainly could use some good medicine for my March options....a little overweight on those.�
Jan 31, 2015
tdiggity I made a couple max-pain plays for the past two weeks too, each time I bought PUTS. Since earnings is coming up in a few weeks, I'll only play the max-pain game if It's buying CALLS.�
Feb 2, 2015
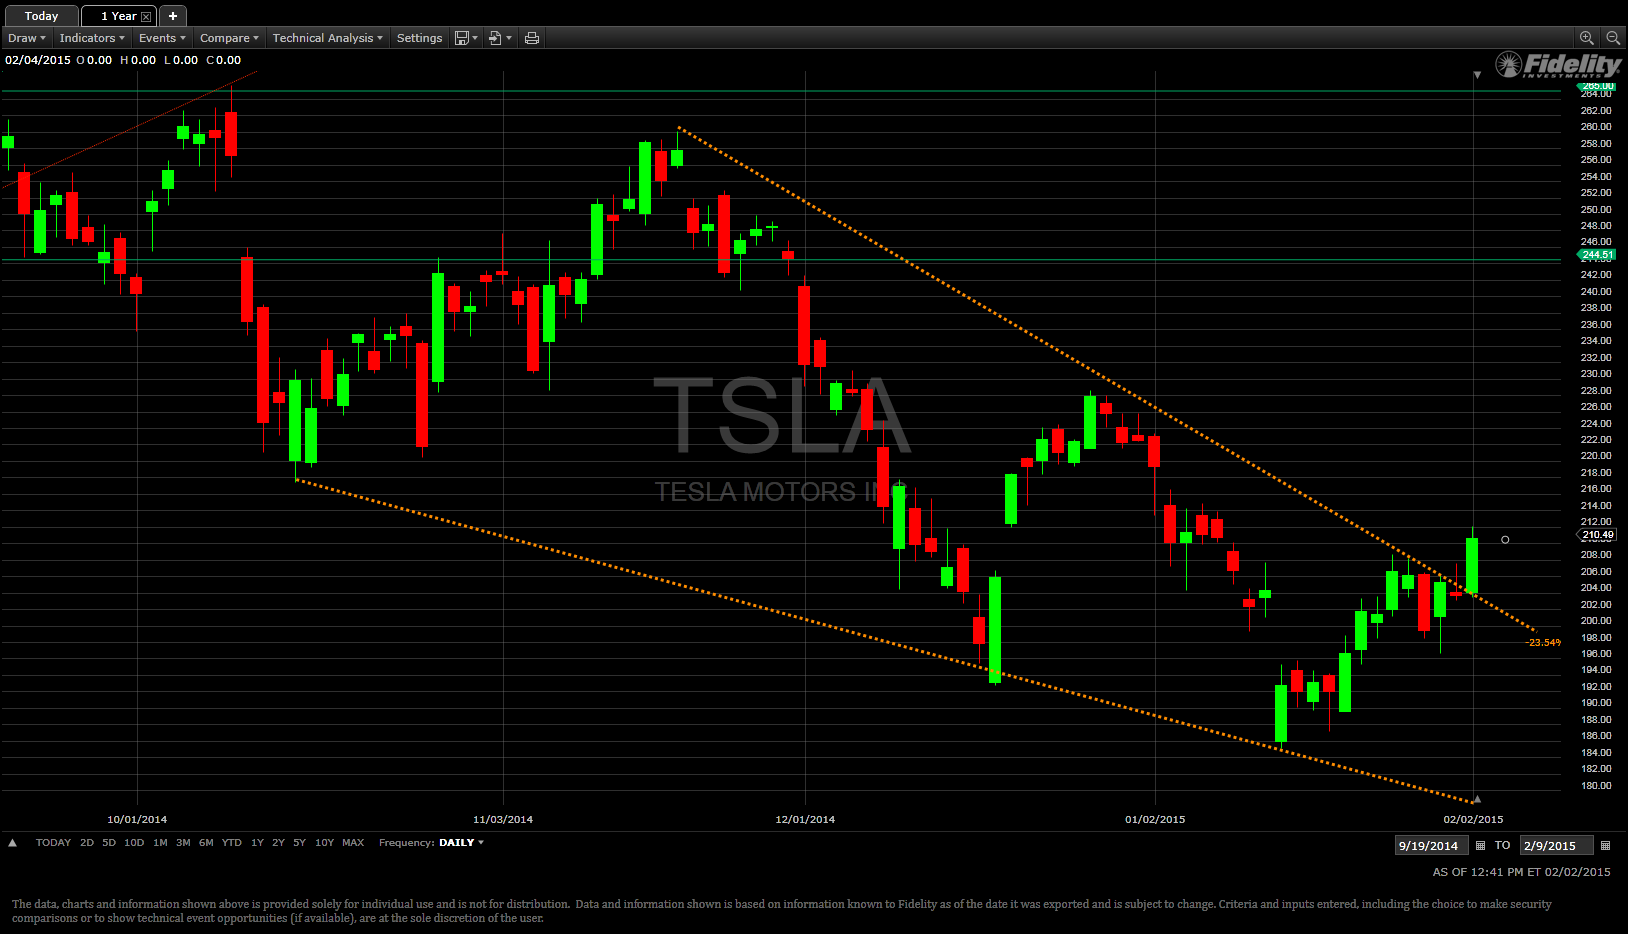
vgrinshpun So far we do seem to break out of the wedge formation on a volume that is about twice of tha volume that we saw in the last week or so. Hopefully we can close a day at this level.
 �
�
Feb 2, 2015
FluxCap Thanks for the chart vgrin, looks interesting. I saw your post last week and agreed -- we seemed set up for a technical pre-ER lurch upward. I'm currently predicting we enter ER around 215-220, but we shall see.�
Feb 2, 2015
chickensevil After the last few ER experiences I really would like to be out of my calls before the 11th so a run up pre-ER would be nice. Especially if my calls are just going to be gain volatility value up to the 11th. Might be a great idea to just sell unless I *really* think we are going to shoot up in a big way.�
Feb 3, 2015
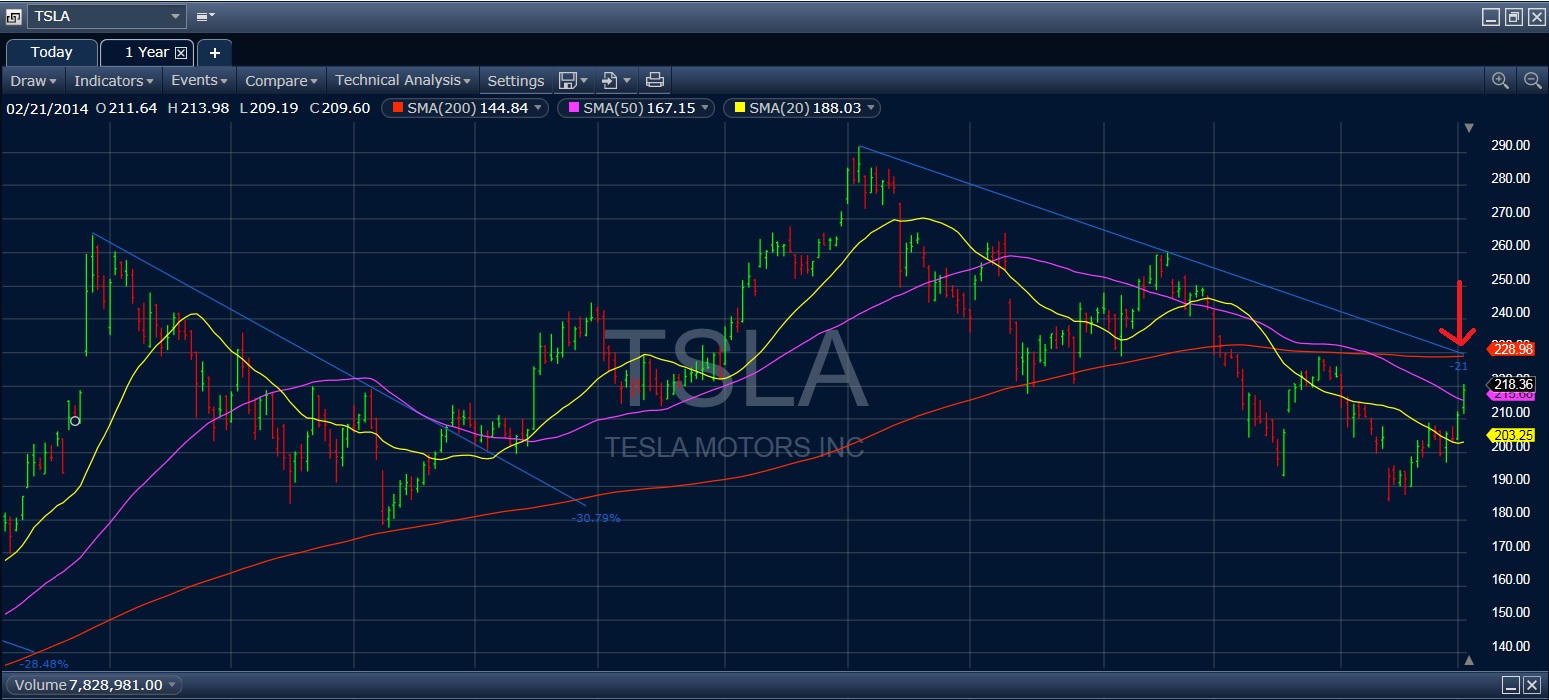
austinEV Finally cleared the 20 day.�
Feb 3, 2015
Robert.Boston But still lagging the 200-day of $228.88. (Here's looking at you, Raffy....)�
Feb 3, 2015
austinEV actually at the 50 day now. Interesting to see if we clear that too.�
Feb 3, 2015
chickensevil From what I can gather about the wedge and breakout is that we *should* go back to the prior uptrend pattern. Which should mean getting back north of about 225-230. If you are a believer in the technicals then that would be the bottom price range I would expect us to get back to in the short term
 �
�
Feb 3, 2015
callnaveen
Good analysis thank you!!!!!�
Feb 3, 2015
vgrinshpun I am not sure whether we will break through the next resistance level of $228.50 from Dec 26th before the ER. The last couple of days there was slight increase in volume, but it was not very decisive. Given the uncertainty of what will transpire at the ER next week, it just feels that there will not be enough momentum to break through the $228.50 resistance before the ER.
 �
�
Feb 3, 2015
chickensevil In fairness, I included 225... Haha! I know that breaking the trend of lower highs and lower lows is going to be tough to break a little positive news sure would go a long way") �
�
Feb 3, 2015
vgrinshpun OK, will make it a deal then, TSLA will settle between $225 and $228 pre-ER. :smile:
Will decide where to go from there based on ER information...�
Feb 3, 2015
maoing 228.5 is a very strong resistance. 200MA plus the down trend line from ATH to post Q3 ER high to 228 level. If we are lucky, I think SP might tease this level briefly before ER. But retreat is high probability. To 228.5, theoretically SP jumped 43 points from 185 low, if no major catalysts, then it's due for a consolidation.
�
Feb 3, 2015
maoing An interesting observation for the last 3 big down cycles in the past 1.5 years.
1) ATH @ 194 on 10/01/13, low point of down cycle @ 116 on 11/26/13, down cycle takes less than 2 months. Then the up cycle peaked @ 265 on 2/26/14, up cycle takes 3 months;
2) ATH @ 265 on 02/26/14, low point of down cycle @ 177 on 05/09/14, down cycle takes 2.5 months. Then the up cycle peaked @ 291 on 09/04/14, up cycle takes 4 months;
3) ATH @ 291 on 09/04/14, assume low point of down cycle @ 185 on 01/14/15, down cycle takes 4.5 months.
Based on above observation, the down and up cycles take longer and longer because TSLA was losing mania gradually. Extrapolated from previous two down and up cycles, I guess the new ATH might be hit around 6 months from 1/14/15. It could be coincident with model X reveal and blow-out Q2 ER. Historically 291 ATH was hit with Gigafactory deal, in 2015, the model X reveal is the only major event IMO.�
Feb 3, 2015
chickensevil I'm sure it will have a minor pullback before we propel higher. Stocks don't trade in just one direction. We also historically (at least best as I can remember) have a consolidation/selloff just before (the one or two days prior) to the ER. Wouldn't surprise me to see us finish this climb through Friday, trade roughly flat for Monday, and then be in the red on Tues/Wed. Barring no major macro event or significant Tesla news.�
Feb 3, 2015
maoing I have similar feeling. Check the 3 big red bars before Q1 ER. Rally all the way from 190 to 218, then took two days dropped to 200 before ER, the post ER day was -10%. So it's bathblooding 40 points drop in 3 days.
�
Feb 3, 2015
chickensevil If we have a down right around 6 months then you would be looking for a decently negative event surrounding the X release. Since 6 months is roughly the July/August timeframe. I subscribed to the up down cycles in the past as well, but generally just to predict when we would hit the bottom, not the top. I guess it works both ways but boy, I wouldn't be betting the farm against anything but spectacular news surrounding the MX as a product (although there could be other reasons for a drop outside of that... I don't really want to think about it)
- - - Updated - - -
Yeah ER could go either way obviously, positive news and price drop, negative/neutral news price increase... Can figure that one out sometimes) but the pre ER buildup for this stock is different from other stocks I have watched.�
Feb 3, 2015
maoing Sell on news is one of the biggest negatives, we've learnt from gigafactory deal and model D reveal.
Also same exact ER might have totally different market reaction per different timing and pricing.
�
May 18, 2015
austinEV This South Surrey Mom's amazing secret to lose belly fat and reduce her mortgage??�
May 20, 2015
ev-enthusiast Volume seems to be very low today, currently 80k after 2hrs compared to 5M per day average.
If I remember correctly average was about 10M quite some months ago...�
May 20, 2015
ggr Yes, all week has been quite low volume. But I don't recall the average volume (90 days I think is what's usually reported) ever being much over 6M.�
May 20, 2015
ev-enthusiast Yea, might have been in 2013.
Good times�
May 20, 2015
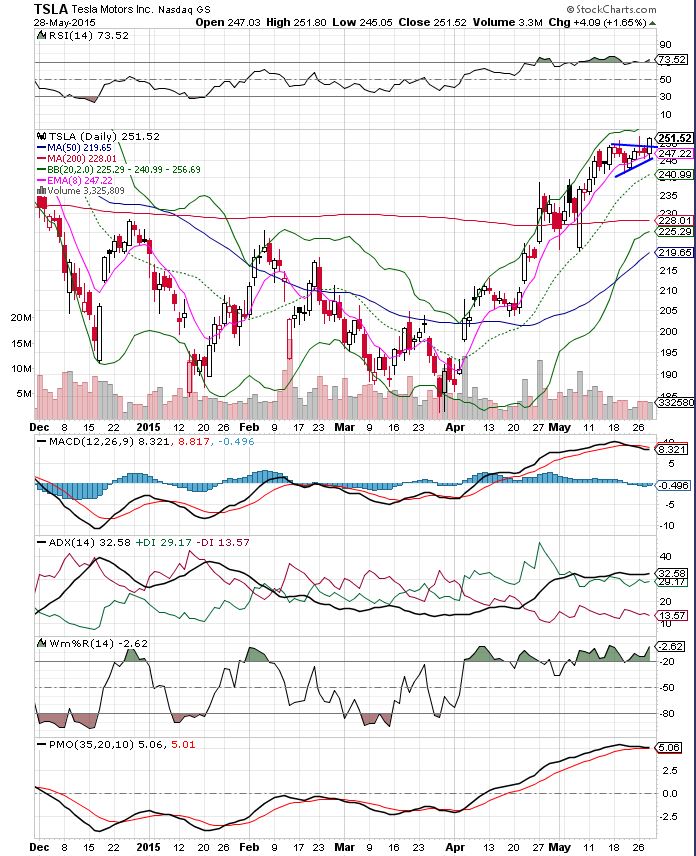
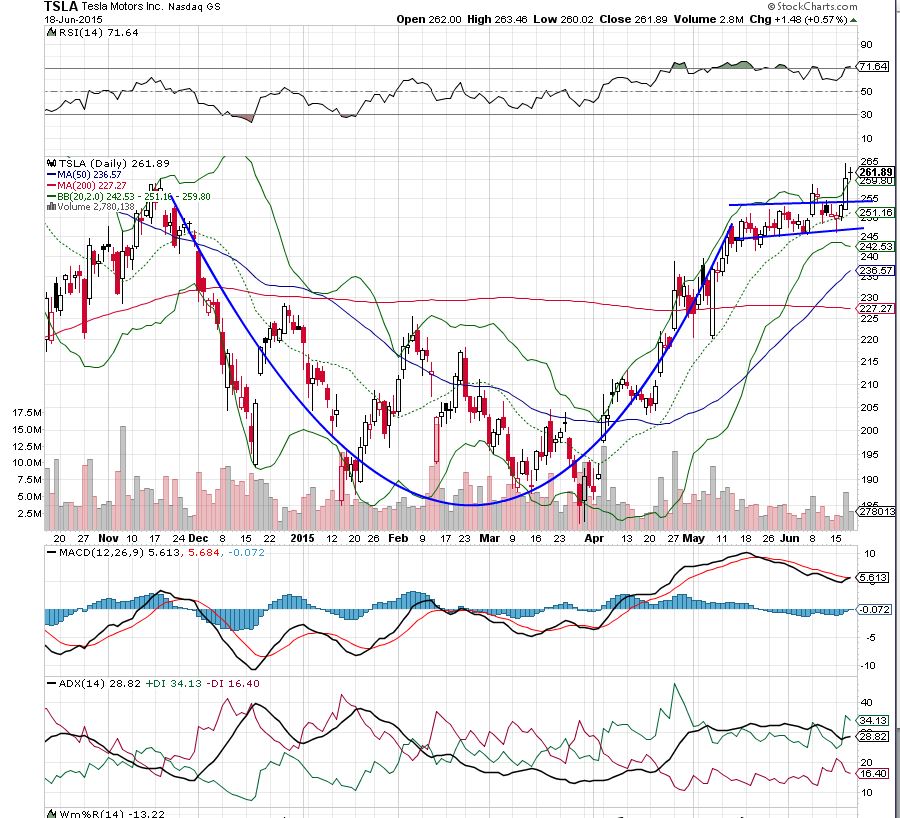
ev-enthusiast Here is a current daily chart showing a possible regression channel.
Lower bound is at about $240, we'll see if this is support during todays trading session.
RSI was a bit high (above 75) recently signaling overbought.
Next resistance could be $260.
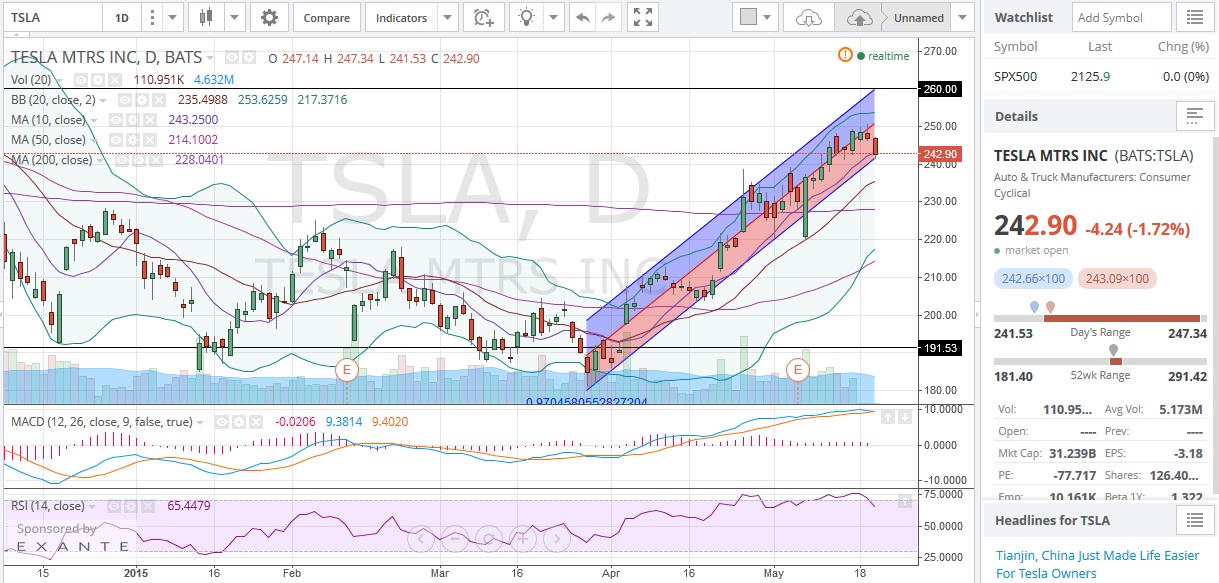
What do the more experienced chartists think about the current situation?
Any unicorns?
Update: Max Pain for options expiring end of this week is currently at $245.�
May 21, 2015
ev-enthusiast Max Pain is still $245 for options expiring end of this week.
Looks like a pin at Max Pain.
Let's see if we can get a close little bit above the Max Pain value today.
Update: Today's close came in at $245.55 with low trading volume compared to the average daily trading volume. RSI at 68.8 right now.�
May 24, 2015
ev-enthusiast We got great support and a nice bounce at the lower channel boundary during the last days.
One more leg up in the current channel would bring us roughly in the $260 area where we could see some resistance.�
May 27, 2015
austinEV What does everyone think of the chart? If I squint I see a triangle formed so we should break out, right? And with the current bias upward, shouldn't we break out to 260 in the next 10 days? (Fib resistance, etc).
I would draw on a chart, but its pretty clear...�
May 27, 2015
ev-enthusiast Hi austinEV,
agree on the triangle.
We are currently sitting right above the lower regression channel boundary.
Each of the prior three legs up made a move of about $20.
As far as I can see one more leg upwards in the current channel would propell us to the $265 region in about 10 days.
Could you please draw a chart?
Where do you currently see the fib levels?
Thanks in advance!�
May 27, 2015
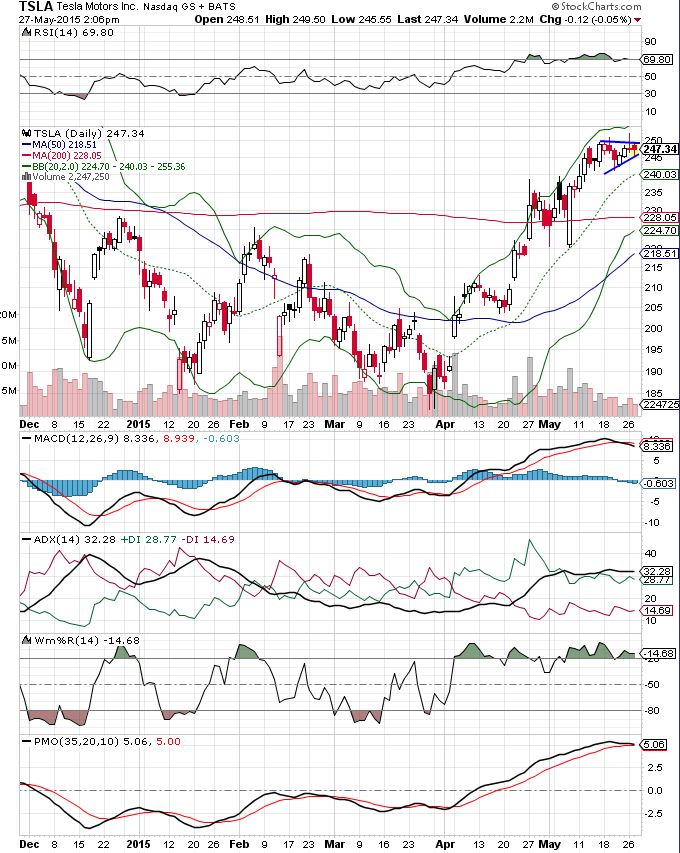
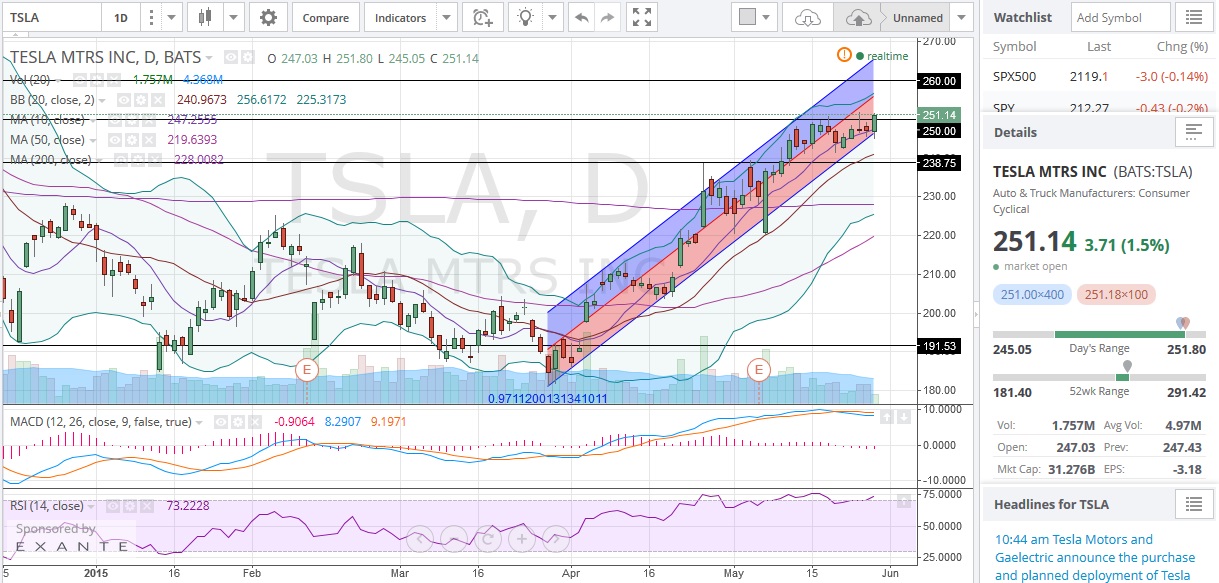
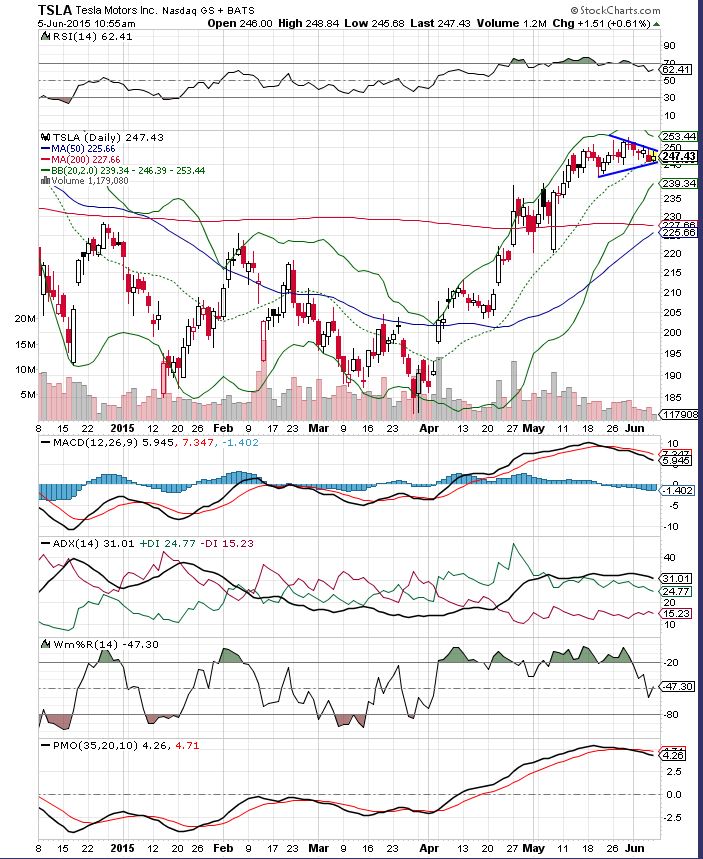
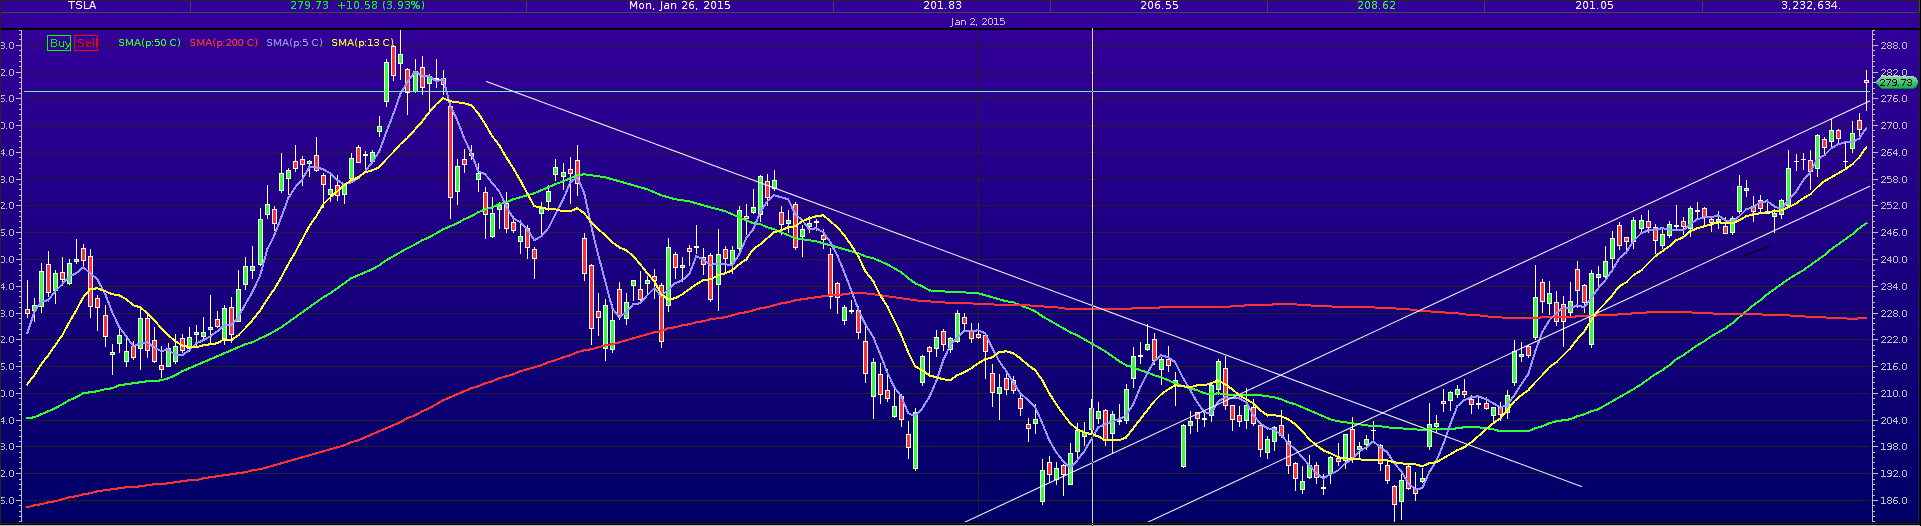
austinEV
Here you go. I think a lot of people are looking at 260 as potential resistance since that was the last local top, and some Fibonacci magic that I don't know. There is no real reason to hang out where we are right now, between the 20day MA and the 260 level. I added the 8 day EMA because this recent rise has been riding it and it is still defending.
A bit more zoomed in:
 �
�
May 28, 2015
ev-enthusiast We got a nice bounce from the lower regression channel boundary.
Let's see if we can get a close above $250.
 �
�
May 28, 2015
austinEV Yeah that cap at 250 has been firm. grrr, back at 250 as I type.
TA thread has been a ghost town lately. There is a actually something to talk about now folks!�
May 28, 2015
ev-enthusiast Today's close came in at $251.52 slightly above the $250 mark.
That's a palindrome of figures, nice
We got a nice bounce from the lower regression channel today.�
May 28, 2015
austinEV Not to jinx anything, but looks like a breakout forming to me. Above 250. Broke out of the triangle to the upside:
 �
�
May 29, 2015
ev-enthusiast This weeks close came in at $250.75, slightly above $250.00.
Looks like the $250 area turned into support during the last couple of trading sessions.
On the daily chart today's candle seemed to form a shooting star but in the end it turned out to be a DOJI.
Looking forward to next week.
Please always be careful with your investment and happy trading.�
Jun 1, 2015
ev-enthusiast Max Pain moved up to $247.50 (link).�
Jun 1, 2015
chickensevil Oh thank you for finally fixing that messed up post, now that I am like 4 posts from it finally pushing to the next page for me, Lol. Am I really the only one who has it set to 100 per page?
In any case, I am rather shocked how much of a steep straight line up we have had since the last major low point. How long will this keep up? Seems like 250 has really been that stopping point so far even though according to everything I have seen that should have been 260 right?
So if 250 is to be our battle ground does that bode better or worse for taking on 260?�
Jun 1, 2015
doggusfluffy Not only that, but I believe no analysts still have even re-evaluated their PT by including an auto + stationary model yet. Does that mean it was "baked in" already or hasn't been accounted for yet? It seems like the most surreal non-reaction with even some open skepticism to a very compelling price point.
Shrug.�
Jun 2, 2015
chickensevil Even if the analysts haven't baked it in, the Market is clearly reacting. The price hasn't had this steep of a climb in a while.
Let's see here:
April 26 - June 28, 2013: 51.20 - 107.36
June 28 - Aug 30, 2013: 107.36 - 169.00
Jul 26 - Sep 27, 2013: 129.39 - 190.90
Dec 27, 2013 - Feb 28, 2014: 151.12 - 244.81
Jul 7 - Sep 4, 2014: 222.66 - 286.04
Those are the biggest rises in a 2 month period I could quickly identify.
The differences in price looks like this:56.16, 61.64, 61.51, 93.69, 63.38
That is an average rise of 67.27, although I would consider that 93$ rise more of an outlier because we had super awesome amazing fantastic news no one was expecting that caused that rise. The first three data points were all over the first major rise from the 30s and the most movement we had in 2 months was about 60$ so I would guess that is easier to ride.
So what does it look like right now?
If the bottom was Mar 27 @ 185 and the top is May 28@ 251.45 that is, 66.45 difference.
Point being, the market is clearly reacting to the various news we have had over the past 2 months. The real question is... can it continue? If we are back "in the glory days" of 2013, we had from April 26 to Sep 27 to run up to the top... or 5 good months of a straight climb (which I believe was also the longest run up period of the stocks history). If we see a repeat of that, we could see the price climb another ~90$!!! Unless the Model X actually shows itself before Aug, I think we will see a pull back and/or flattening out of the price.�
Jun 3, 2015
Renaud In the meantime, maxpain just climbed to 250 for this week.
As for TSLA, it seems it ran out of steam once it touched above 252...
Let's see if these sales figure give a bit of juice...�
Jun 4, 2015
ev-enthusiast TSLA seems to always pay attention to the Fib levels (in case of support as well as in case of resistance).
There is currently a Fib line at about $249.40 where we got some trading around that number during the last days.
While we did not manage to hop over that Fib line we got a little outside of the lower regression channel boundary.
Today's move appeared to follow the downwards movement of the rest of the market on low volume.
A close tomorrow at Max Pain of $250 will bring us again closer to the lower regression channel boundary, but it looks like we will still be a bit outside of the channel.
Some positive news next week (e.g. at Shareholder Meeting June 9th) will help to regain the channel.
Update:
Max Pain still at $250 (link).�
Jun 5, 2015
austinEV Still feels like a triangle wanting to break out. The last little breakout I called didn't confirm and it went on consolidating. Triangle, base, it's some consolidation forming.
 �
�
Jun 5, 2015
ev-enthusiast Max Pain for today is now $247.50, let's see if we get some momentum and close a bit above that value.
Update:
Today's close came in at $249.27 close to the HOD at $249.70.�
Jun 5, 2015
drinkerofkoolaid Feels like consolidation that's about to breakout and re-test the 52 week high. Seems to be more nervousness on TMC and too many people still saying battery storage won't add much to Tesla's stock. These same firms claiming to be bearish on Tesla, have been accumulating shares. Dougherty is the only person who has sort of priced in battery storage and just upgraded her price target to $350.
Last week, many were saying the chart looked a lot like a head and shoulders. I'd bet many went short based purely on this. However, the consolidation over the past week technically makes the head and shoulders look more like a base before a breakout. Interesting. Anyone have the figures of shares available to short?�
Jun 8, 2015
ev-enthusiast Last Friday SP closed at at $249.27, a little bit above max pain that was $247.50 for that day, RSI came down a bit to 64.7.
Premarket action is currently looking strong with the Panasonic announcement to speed up investment in Gigafactory and new analyst notes with upped price targets.
Looks like a move up about $6 to hop over the lower regression channel boundary back again into the regression channel is possible.
Additional positive events like EM speech later today and Shareholder Meeting tomorrow could generate positive news that might help to regain the regression channel.
A possible next resistance could be the peak from 2014-11-18 at $260.�
Jun 8, 2015
chickensevil Yeah, if there was any concern over which direction we would be going after the very long consolidation at the 245-250 level I think today will finally show the direction. I wouldn't be surprised to see us make a run up this week to 260 and start testing that level. I was rather surprised at how long we sat at this level, so I hope this isn't a sign of how hard it is going to be to break and hold 260... *yikes*�
Jun 9, 2015
ev-enthusiast Two interesting things come to mind when looking at the current daily chart of TSLA:
- The strong upwards move from yesterday and the close at $256.30 brought us right back into the old ascending regression channel.
- The 50 DMA is about to cross the 200 DMA any day now forming a golden cross, very bullish sign.
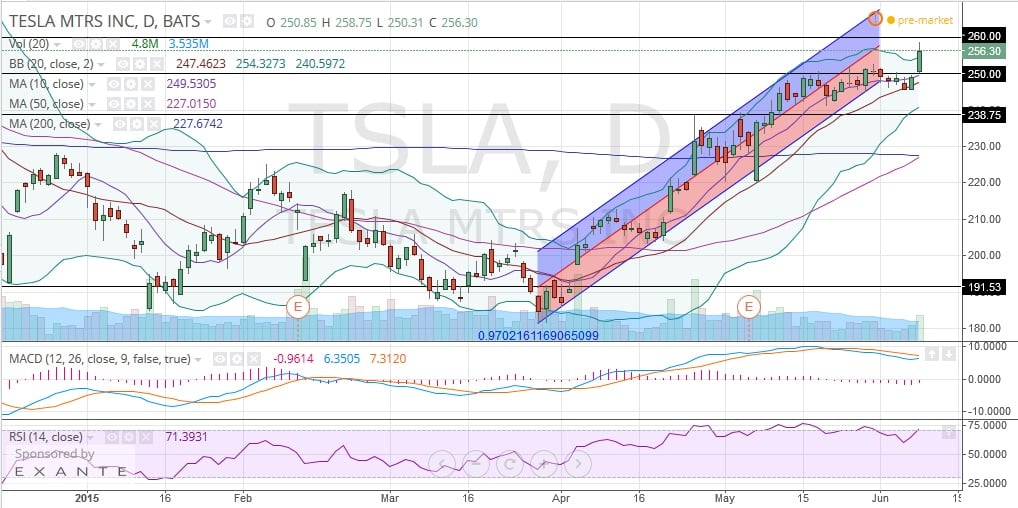
One more leg up in the current ascending regression channel would propell us roughly to the $276 area.
There could be some resistance at the $260 level like we have seen with $250 area.
Official news about Model X configuration such as Model X design studio going online and subsequent press coverage could be a strong catalyst this June and could provide enough power for one more leg up in the current channel because it would confirm that Model X is on track for first deliveries.
Last ATH at $290.
Max Pain for this Friday currently sitting at $245.
Short interest figures out today afternoon as well.
Does not look like the exactly right time to gamble a bit on the short side�
Jun 9, 2015
chickensevil I'm sure Max Pain will drift upward as the week goes on. I think people were betting on the lower side there because of last week. Even if it doesn't I don't see us getting pulled back down to 245 as that would be a 10$~ drop. It would likely take quite a bit of effort to drag us back down that much at this point especially with very strong support now at the 250 level.�
Jun 9, 2015
Drax7 Theoretically , what is max joy point?
Would max joy equal max pain ?�
Jun 9, 2015
austinEV Max Joy doesn't compute... zero for put holders, infinity for longs. I would be pretty maxxed out at $500/share. lets do that this week...�
Jun 10, 2015
ev-enthusiast Max Pain up to $250 now (link).�
Jun 10, 2015
cctv Max joy is ... in the eyes of the beholder
For MMs, our max pain is their max joy
For one direction strategy holder, max joy is the farthest point from max pain, which direction? depends on your position
For complex strategy holder...why you make it so complicated? Don't you know simple is beautiful and probably the most efficient way?�
Jun 15, 2015
austinEV Wow, it made it back to the 20day MA like a rubber band.�
Jun 15, 2015
ev-enthusiast Max Pain currently sitting at $235 (link).
With this sideways trading it looks like it is getting more and more difficult to regain the regression channel.�
Jun 16, 2015
Bgarret What would make it drop from $250 to $235 in a week with the stock going sideways?�
Jun 16, 2015
Familial Rhino Macro would do it (a.k.a. Greece).�
Jun 16, 2015
MikeC Is it because this is a quarterly expiration date? So people are holding options that they bought when the stock was lower, as compared to weeklies?�
Jun 17, 2015
sahanim testing 262. been a resistance according to fib levels in my books.�
Jun 17, 2015
FluxCap OK chartists. What's the play here?�
Jun 17, 2015
austinEV It closed above the Bollinger band, which is rare as heck. So, it will probably go down tomorrow... unless it doesn't. If it "confirms" tomorrow by heading up again that would signal a good old fashioned break-out and the sky's the limit (resistance at ATH would be the talk). We have had weeks of consolidation in a narrow range (with one "false" breakout), so it was wanting to break high or low. So, it is breaking out for the ATH or this is another false breakout and we will go back to rangebound.
TL;DR: The stock will go up, down or stay the same. You should be long or short accordingly�
Jun 17, 2015
Bgarret That was truly the best and most accurate technical analysis I have seen. :smile:�
Jun 17, 2015
Johan I'll take one bottle of snake oil to go, please!
No but seriously I agree it could break out over the next few days since 262 is a Fibonacci level that has been defined quite a while back.�
Jun 17, 2015
CALGARYARSENAL I Think we are going to the moon. A Canadian living the American dream. The fast money traders suggest we are in a big-time break out. They have been spot on since 187.00�
Jun 17, 2015
sahanim 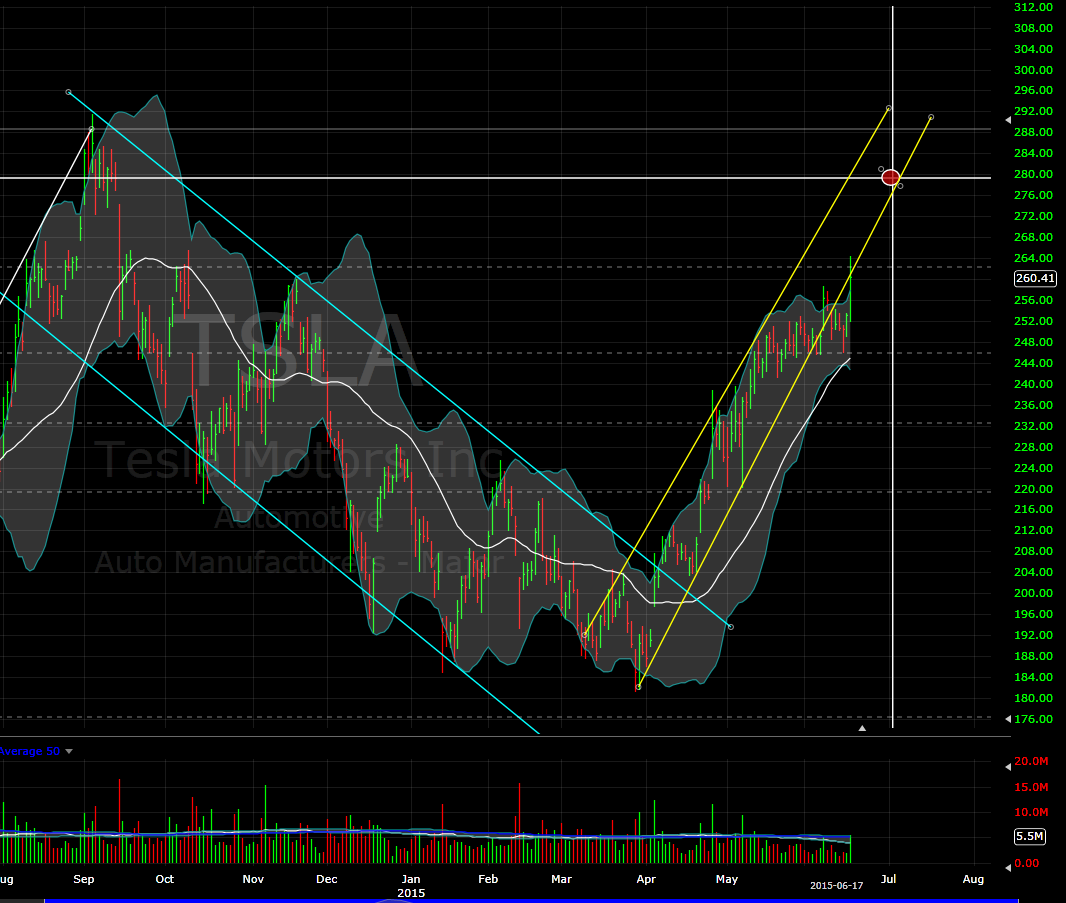
Here's what Im looking at.
We seem to have fallen out of the upward trend over the last couple of days only to barely get back in today. I personally see us going back to the mid 250s over the next week or so. (262 should provide a fair bit of resistance)
If we somehow manage to stay within the trend, sales numbers (on july 3rd?) might be a nice catalyst to bring us to the 280s(marked in red) and start testing the ATH.
Personally I dont see us testing ATH for Q2 sales numbers. I can however see us testing the ATH closer to Model X release
This is my first time sharing my technicals so if there's something glaringly wrong with it please feel free to correct me�
Jun 17, 2015
austinEV It comes with a guarantee as well!�
Jun 17, 2015
jhm I don't always do technical analysis, but when I do, I do it above the Bollinger band with a little Fibonacci number from a way back.
Looks like clear sailing to $292. This could get interesting.
Stay thirsty, my friends.�
Jun 17, 2015
kenliles :tongue:
Personally I'm taking austinEV recommendation.
Always wrong
When Short of a Long
(That's what the wife says anyway)�
Jun 18, 2015
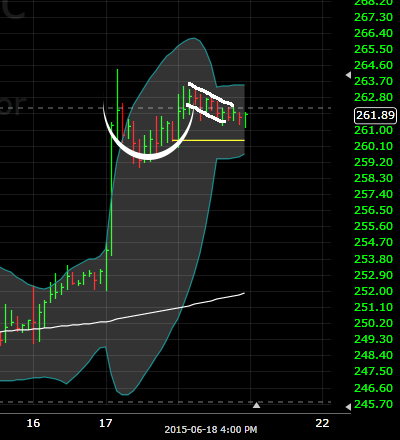
austinEV Trying to draw a cup and handle, per the short term thread. Not sure that is what is going on but it might spur conversation:
 �
�
Jun 18, 2015
Cattledog The light volume of the handle stands out. As do the sugar cubes lumped at the bottom of the cup.�
Jun 18, 2015
jhm Is this the punch bowl of death? Looks like a big red dragon to me.�
Jun 19, 2015
sahanim what about this cup and handle that formed over the last 24 hours? :O
 �
�
Jun 19, 2015
Johan 
�
Jun 19, 2015
hershey101 So much hostility towards TA on these fourms. Can we get back to the serious discussions please? TA has valid applications, and statistical analysis combined w TA produce pretty good automated trading algorithms, so a bit less hostility would be good.�
Jun 19, 2015
Johan I'm not hostile at all towards TA and sorry if it came across as unserious. jhm's words just made me relate to that meme.
I'm in the camp where I don't care if there is actual "truth" to TA or not - as long as enough traders believe in it/use it, it becomes self-fulfilling.
For example now it seems 262 is a hard resistance, as suggested by Fibonacci levels since way back. We're likely not going to break through that this week, but all we need now is one small catalyst to spark a break-out.�
Jun 19, 2015
austinEV I think that a lot of us look at TA "seriously" to a degree. The problem with TA is that even it's proponents will tell you they tend to work best looking backwards. If TSLA skyrockets in the next 3 weeks we will say that cup and handle totally predicted it. If it tanks we will say it was a false pattern, no cup really formed, it was really a reverse head and shoulders etc.
Still fun to point out the real patterns when they show up. Bull flag, wedge, cup and handle. But usually there is no clear cut pattern so reading tea leaves should be met with hefty skepticism.�
Jun 19, 2015
Larken I very much appreciate the posters who take their time and draw up charts for us all, I wish it was more frequent even. It's a great additional tool for trying to foresee the movements of the share price.�
Jun 19, 2015
AlMc I agree. While I admit to not fully understanding TA it is another piece(s)of information that goes into my trading stock and option decisions. Thanks to all who take the time to post the charts and their interpretations�
Jun 20, 2015
Yonki I didn't see Johan's post as hostile or mocking TA or anyone - I just saw it as LOL funny.�
Jun 20, 2015
doggusfluffy Exactly and meant to be taken with a grain of salt too. I would like to understand it better myself, warning signals and opportunities alike. It seems like the trading bots are running on TA algorithms too.�
Jun 20, 2015
roblab As one who knows nothing of short term stock trading, I personally enjoy looking at the charts and wondering how they reflect and predict. All those lines and squiggles must mean something!
But I agree. It looks like the Dragon. I see tail, legs, body, neck and nose. All I need now is for someone to tell me what it means. Then next week some time I will check to see if it did what it was supposed to. 50 - 50 chance, at least.
I love it!�
Jun 21, 2015
winfield100 i like the A/D (accumulation/distribution ratio) from my looks, the 1 day, 5 day, 10 day, 3 month, 6 month, 1 year, 3 year all have upward pressure. only the 1 month is neutral to slightly negative. basically use that, 20 day and 200 day MA and bollinger bands, all seeming to look like sheep entrails but with slightly more information�
Jun 22, 2015
ev-enthusiast Hi winfield100, thanks for your post about A/D ratio. At what parameters do you look for A/D ratio and what tells you stock is more in accumulation mode or distribution mode? Thanks in advance!
Max Pain moved up and is currently sitting at $255 (link).�
Jun 22, 2015
winfield100 i go on to simple schwab account and select "charts" then add A/D ratio and have to manually change days to get each number. this is NOT advice btw
Accumulation/Distribution shows whether buyers or sellers are more active. 200 day MA is very gently flat to up. i do have cash on the table (and a GTC sell order for 100 shares @ $3,500 that needs renewing soon)�
Jun 22, 2015
ev-enthusiast Thanks for the additional info, found the indicator in my trading account.
Update on Max Pain:
Max Pain moved up to $257.5 (link).�
Jun 23, 2015
Joel Can someone post a chart and their analysis following today's close. Thanks in advance.�
Jun 23, 2015
austinEV See my post in "trading strategies". Basically I don't see resistance until a new ATH, maybe 300, even $330 wouldn't be out of the question by the end of the year (barring macro issues, black swans, don't trade on this, etc).�
Jun 25, 2015
ev-enthusiast Max Pain moved up to $260.0 (link).�
Jun 25, 2015
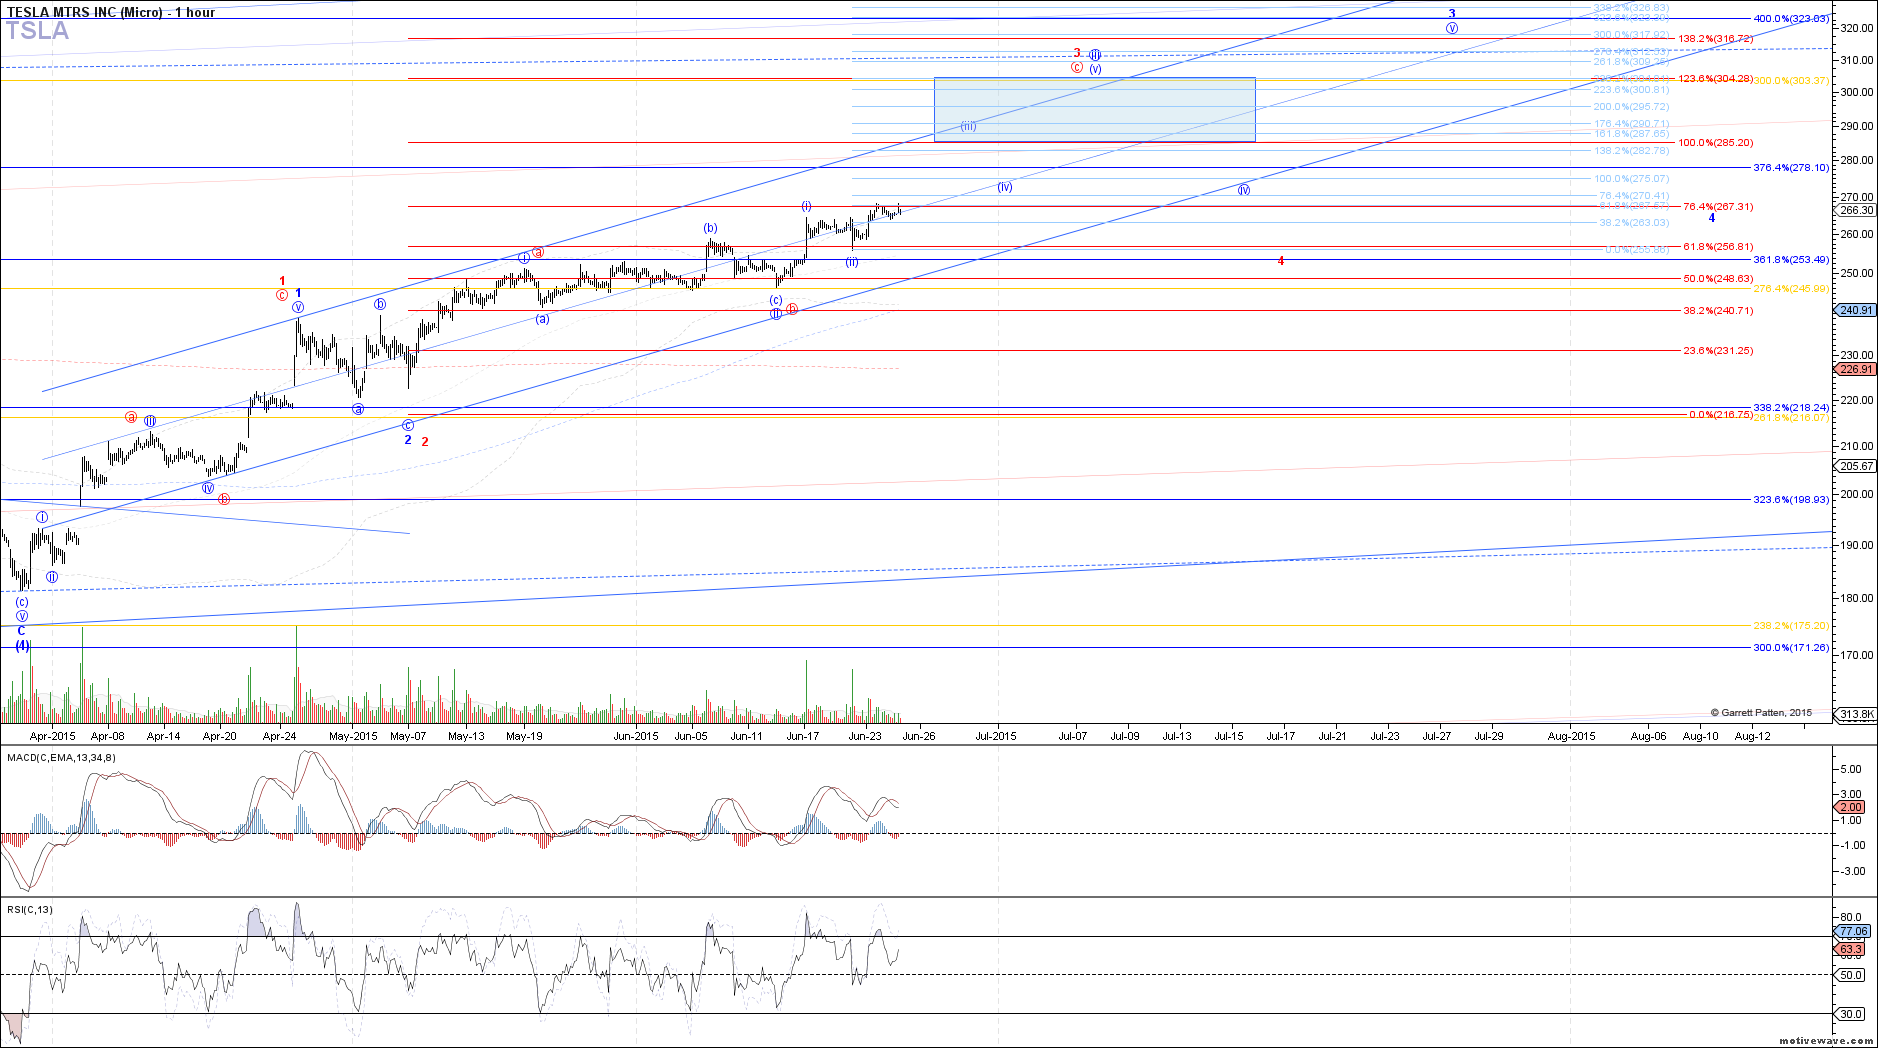
Curt Renz As published this afternoon in MarketWatch, a technical analyst who specializes in Elliott Wave theory sees TSLA on track to reach 285 to 305 by next month if it remains above the June low.
Link to article: Positive sentiment powers Tesla's drive toward record highs - MarketWatch
Below is the chart that accompanies the article.
 �
�
Jun 30, 2015
Curt Renz Technical analysis from Financial News Network Online as published by Zacks today: Bullish Moving Average Cross by Tesla�
Jul 2, 2015
austinEV We are right at the bollinger band (at $276). I bet we close there.�
Jul 2, 2015
AlMc How would you, and other TA TMC members, interpret a close at, below or above that band for our movements next week? Thanks�
Jul 2, 2015
austinEV My observation was just about how powerful the BB is for intraday movements. We started out all fireworks, going to the moon (above the BB). But we get pulled back to it like a rubber band. That is fine, the upper BB goes up too and we have been riding it up for a few weeks. The SMART trader (not me) would have sold when it overextended and re-bought later in the day.
I don't think this has any bearing on the next few weeks.
Other TA suggests we are in a bull run and will retest and probably exceed ATH, but I wasn't adding to that discussion.
Edit: it closed above the upper BB, so all the more remarkable move at the close.�
Jul 2, 2015
Joel I would appreciate if someone could post some charts and analysis before this Holiday weekend. Thanks!�
Jul 4, 2015
Electrifying Closed above the huge down gap from Sept 15, 2014 on a tiny up gap, which is bullish. However it went outside the up channel started on 04/27/15. If it can hold above 276 for the next 5 days, I think it will test 290 and push for ATH. Otherwise it could fall back into the up channel.
 �
�
Jul 5, 2015
Chickenlittle Thanks for the work. So we can go up for go down. Can it not change too?�
Jul 6, 2015
Chickenlittle your analysis right on. it went down.�
Jul 6, 2015
Jonathan Hewitt Double doji on the daily period? (yesterday and today)
Double Candlestick Patterns ~ Forex Trading�
Jul 7, 2015
Jonathan Hewitt Well, it was right. Increased volatility today. #hindsight20/20�
Jul 8, 2015
ev-enthusiast Does anybody else have the impression that $260 and maybe even more $250 area could act as future support when looking at the daily chart of TSLA?
I do currently not see a catalyst that could drive us down to that support area (Greece not important enough, China not important enough, ...) just thinking about the technicals.
Next resistance could be at the $292 area as I would expect some selling at about the former ATH.�
Jul 8, 2015
austinEV I don't like how we lost the 20 day. I did NOT see this coming. the 50 day is at 250, that should be support if it gets that bad. I hope this just snaps back to the 20 day.�
Jul 8, 2015
Robertj Cup with Handle Chart Formation
A cup with handle chart formation might see a handle of 1 to 2 weeks at a depth of one third of the advance
so that would see a bottom at about $ 245
Cup with Handle (Continuation) [ChartSchool]�
Jul 8, 2015
Johan Only if we see the same forming in the general markets, which if we do will seem to us how all of a sudden TSLA is doing much better (since so is the general markets, as the cup turns upwards).
If the general markets keep falling don't expect TSLA to follow it's own "separate" cup-and-handle formation, no TSLA will be caught in the downmarket too (an instance of where fundamentals eat technicals for lunch).�
Jul 10, 2015
ev-enthusiast I am currently looking for a close above $260 area, in my opinion this would be a positive sign.
Progress in Greece should provide some positive sentiment, TMC Connect this weekend, Model X configurator getting closer and closer.�
Jul 12, 2015
highend yes. and it will be $244..
Please look at my chart.
http://images68.fotosik.pl/1036/a61ea2de8e76fc36.png
Made in Poland�
Jul 14, 2015
Jonathan Hewitt Closed above the 21 day moving average today. This DMA has provided support in the past.�
Jul 15, 2015
sahanim if we dont see any price movement in next week we'll be setting ourselves up for a nice pop with MX design studio and ER around the corner form then. �
�
Jul 20, 2015
Jonathan Hewitt As a follow on to previous discussion, Cup and handle? What do you guys think. Credit of the chart goes to @venkysrinivasan on stock twits
http://charts.stocktwits.com/production/original_39970058.png?1437429454
Here's what a cup and handle is for those unfamiliar.
http://www.investopedia.com/terms/c/cupandhandle.asp
Personally, I think it's pretty sloppy but if enough people think that is what is going on we can get some self fullfilling prophesy going on here! Oh, and there's this thing called earnings which can either make or break it.�
Jul 20, 2015
atang
Yes John, pretty sloppy, but I'll take it! Thanks�
Jul 20, 2015
Theshadows All I can say is remember when we were fighting to retake the 200 day moving average? Those were the days.
That was only a few weeks ago.
Thanks for the cup and handle link. I understand it better now. I don't think we fit the description of the article.�
Jul 21, 2015
austinEV I agree there is no cup and handle. Not sure why we keep seeing people try to find it. The stock can go up without such an excuse.�
Jul 21, 2015
austinEV I am controlling the stock price...
So, I have hesitated to publish this due to its earthshaking nature, but I have suspected for some time that I was controlling the TSLA stock price.
If I go on a diet, TSLA goes up. If I slack off, TSLA slumps:

We went out of sync pretty badly during the late 2013 highway f*** fud but the broad trend is there. (Note the weight axis is reversed. Weight LOSS is associated with stock price INCREASE).
Bottom line is I am rocking my new diet so I am feeling Bullish.�
Jul 21, 2015
Bunky Please stop eating immediately, thx :biggrin:�
Jul 21, 2015
Papafox AustinEV, don't be surprised if your intervention begins within the next few hours. Four big guys jump out of a black Tesla with Jenny Craig and weightwaters meals in tow. Relax, Mugsy and the boys won't be too much trouble around the house over the next couple of weeks if you feed them pizza and beer while you nibble on something with no more calories than a piece of celery. Reports of smoking, cussing, belching and womanizing from the crew have been somewhat exaggerated in recent reports. They'll likely leave early if the Q2ER is positive. If there's a Ms. austinEV, it'll be better to get her prepped for what's coming, rather than surprise her. All of this is for the good of you and your fellow forum members, austinEV. We appreciate your cooperation.�
Jul 21, 2015
austinEV Those thugs might also be force feeding ME the pizza and beers depending on their agenda. Frankly that is the easier way to manipulate this phenomenon.�
Jul 21, 2015
EldestOyster Yes, watch out if it's a bunch of Short guys.�
Aug 10, 2015
austinEV hate to be Beary McBear but I think we will go to the 200 day (practically there):

Discuss...�
Aug 10, 2015
justthateasy
I agree, possibly lower actually.
I just looked at my own chart and we're in uncharted territory again with TSLA being outside any trends. The only thing supporting TSLA at this point is the daily averages. Right now it feels like it's consolidating before another drastic drop headed to the 220s.�
Aug 19, 2015
highend Hello, so yesterday we reached $260.. and even little higher.
I wrote that $260-262 is important
I also think we should retest previous resistance = $243-244 as support now. Maybe even close gap.
Further UP is only possible after breaking $261 resistance...
That is really simple.�
Aug 19, 2015
sub You said next stop 220 but of course didn't give any time frame. Holding you to that so when it doesn't happen we can stop the guaranteed predictions.�
Aug 19, 2015
highend there are no guaranteed predictions. And no timeframe. But I can tell where is support & resistance.... If we are in ABC correction from the top - then next step is 220..... unfortunately.�
Không có nhận xét nào:
Đăng nhận xét