Mar 29, 2016
Turbo3 I posted the equations I use on the Tesla battery topic. I think you even commented on it way back then. But you will also need the next version which fixes some features (now bugs) and supports full hex in the recipes. The right side scale was not originally designed for fractions which means the current release uses integers to set the limits which does not work well when displaying voltages that vary by a few miliivolts.
I am not happy with the way post filtering looks when first displayed (blank graph because the zoom level is screwed up due to so much of the data being filtered out. I may hold off with the release until I decide how to handle this. You need to manually zoom in a lot before the graph starts to appears.
There are a few ways to handle this I just don't know which is the best at the moment. May need to experiment which will take some time.
I could pre-process the array and remove all the filtered data but then if you select a different plot I need to restore all the data to view it unfiltered or with a different filter. I could have a third array I copy over all the filtered data into meaning I now have three data areas.�
Mar 30, 2016
Turbo3 I have a simple solution to the post filtered trace problem. But it seems to have uncovered some bugs in graphing small amounts of data when zooming and scrolling where I can't zoom in or scroll. I will work on those in the morning. But it looks like a good solution that makes it work the way you think it should.
Fixed one bug so I think it is good enough. Zoom seems limited on a small post filtered trace. Will work on that tomorrow.
Version 0.0.19 is making its way through the system.�
Mar 30, 2016
Turbo3 The next release will fix the zoom limit on traces smaller than the window size.
It will also fix the timescale when viewing post filtered data.
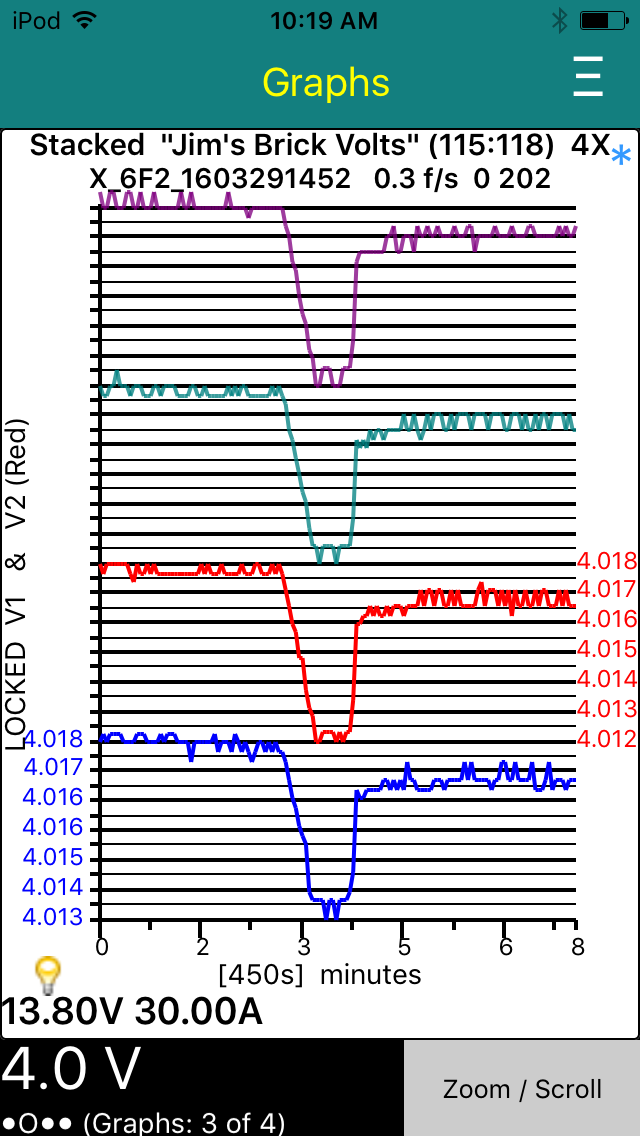
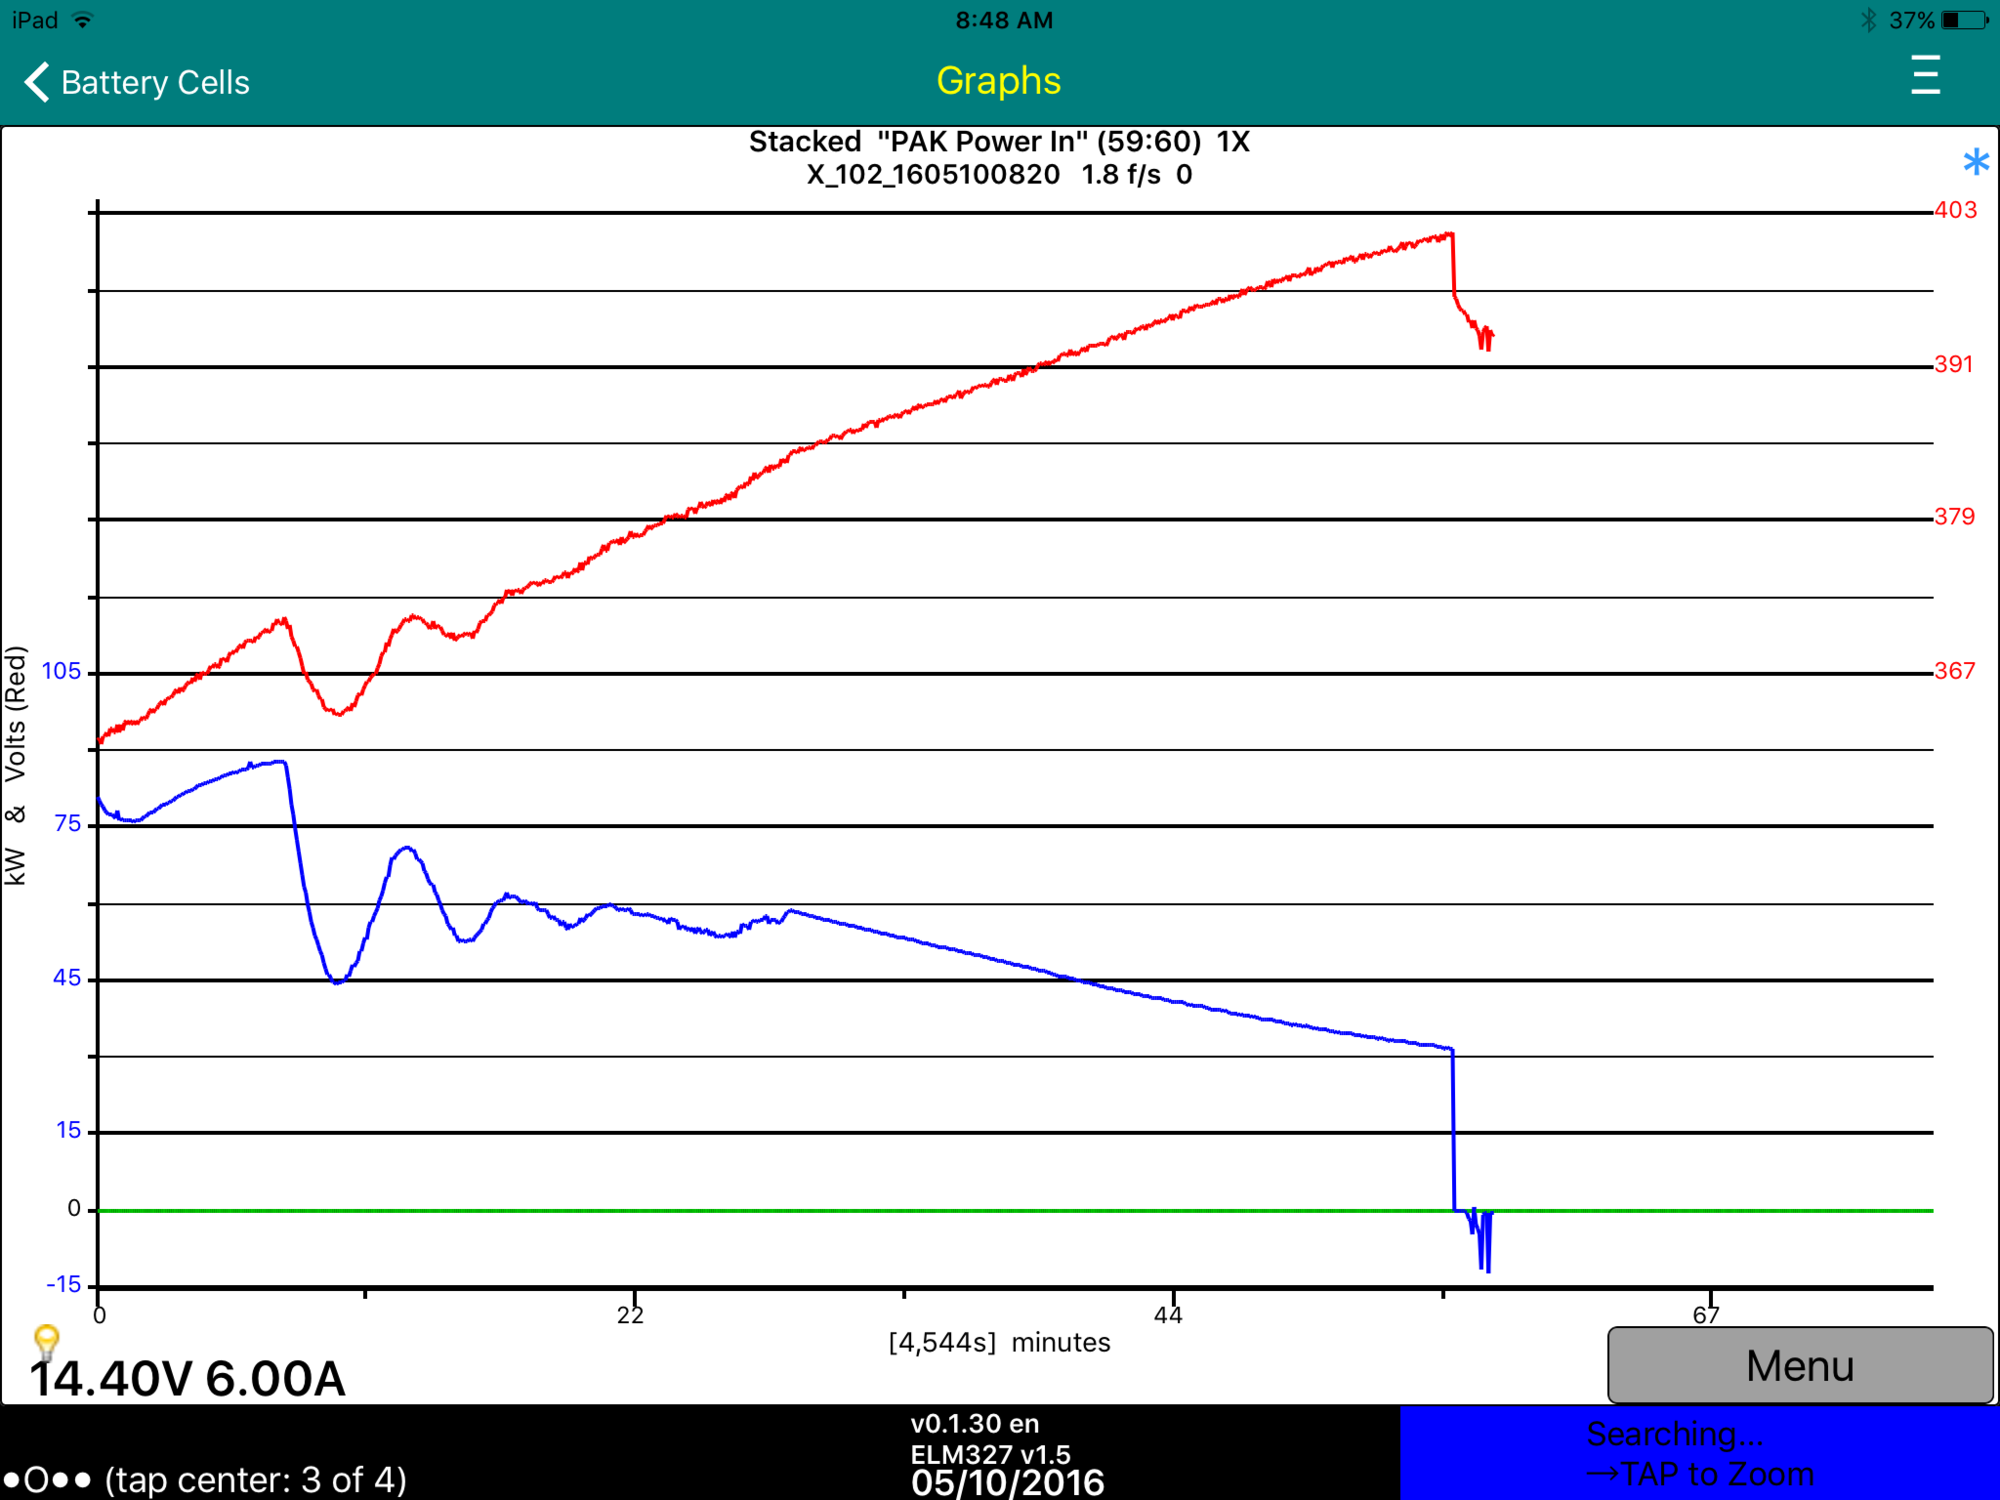
Here is the updated "Brick Volts" graph using this new version. Note the time scale is now correct for this 11 minute trace even though only one in 32 frames is being displayed.
 �
�
Mar 30, 2016
garygid Using v0.0.19, just out a little while ago. Much improved in many ways, Thanks to Jim's hard work.
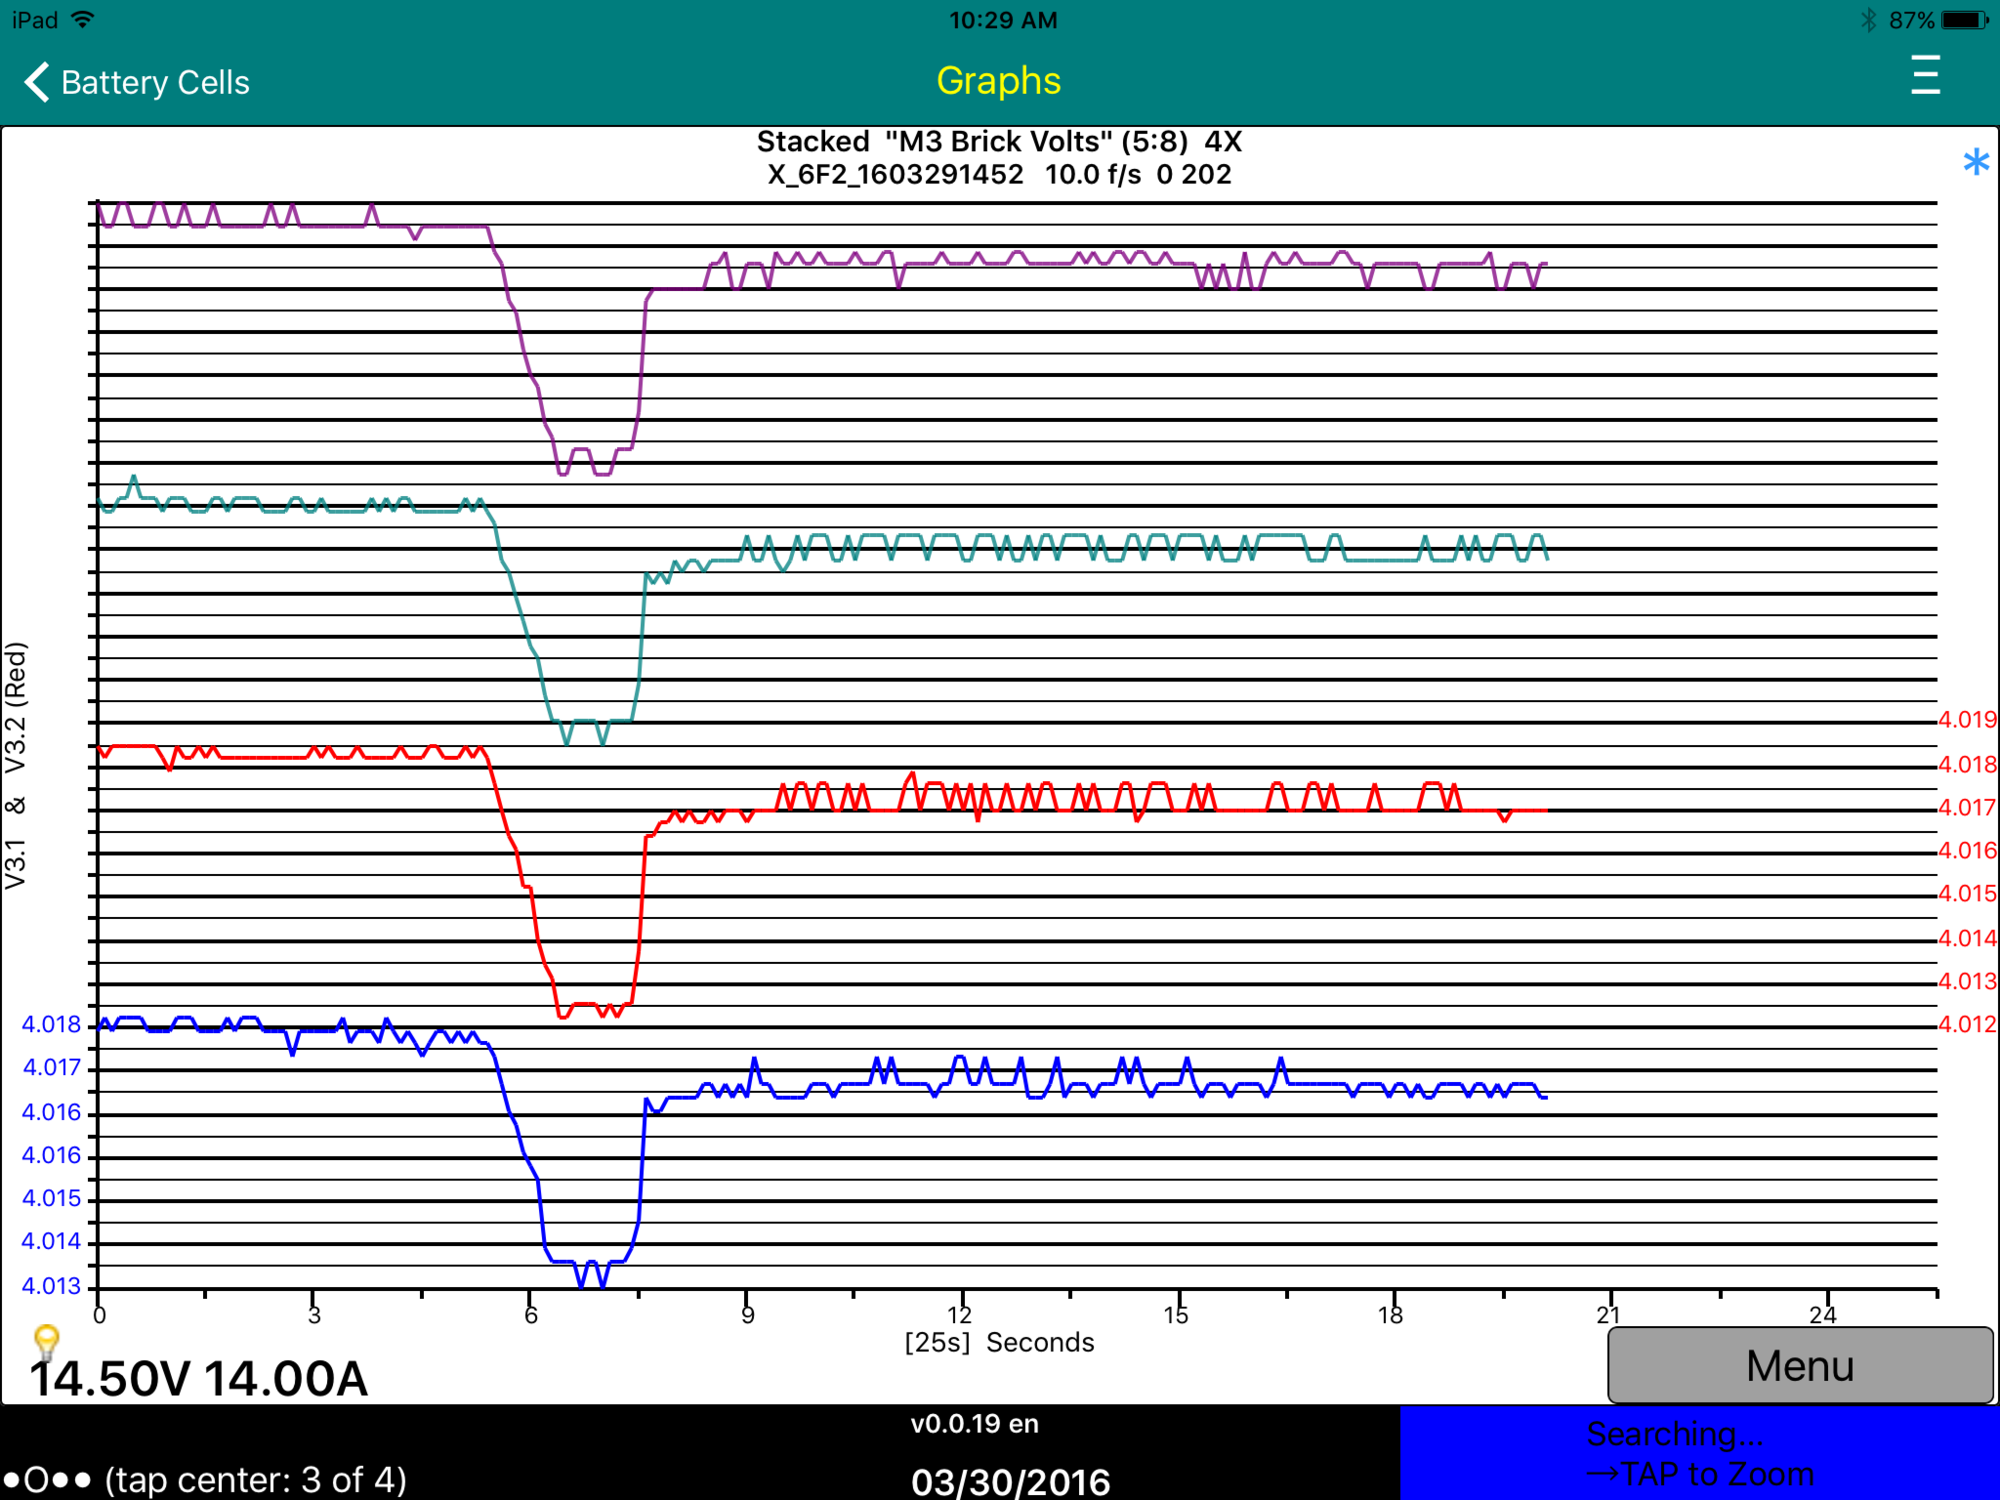
We seem to have the Brick Voltages, here is Module 3 (of 1 - 96), Bricks 1, 2, 3, and 4 (of 1 - 6) as seen in the iPad, which should match Jim's Plot above (I was using the slightly backwards before.):
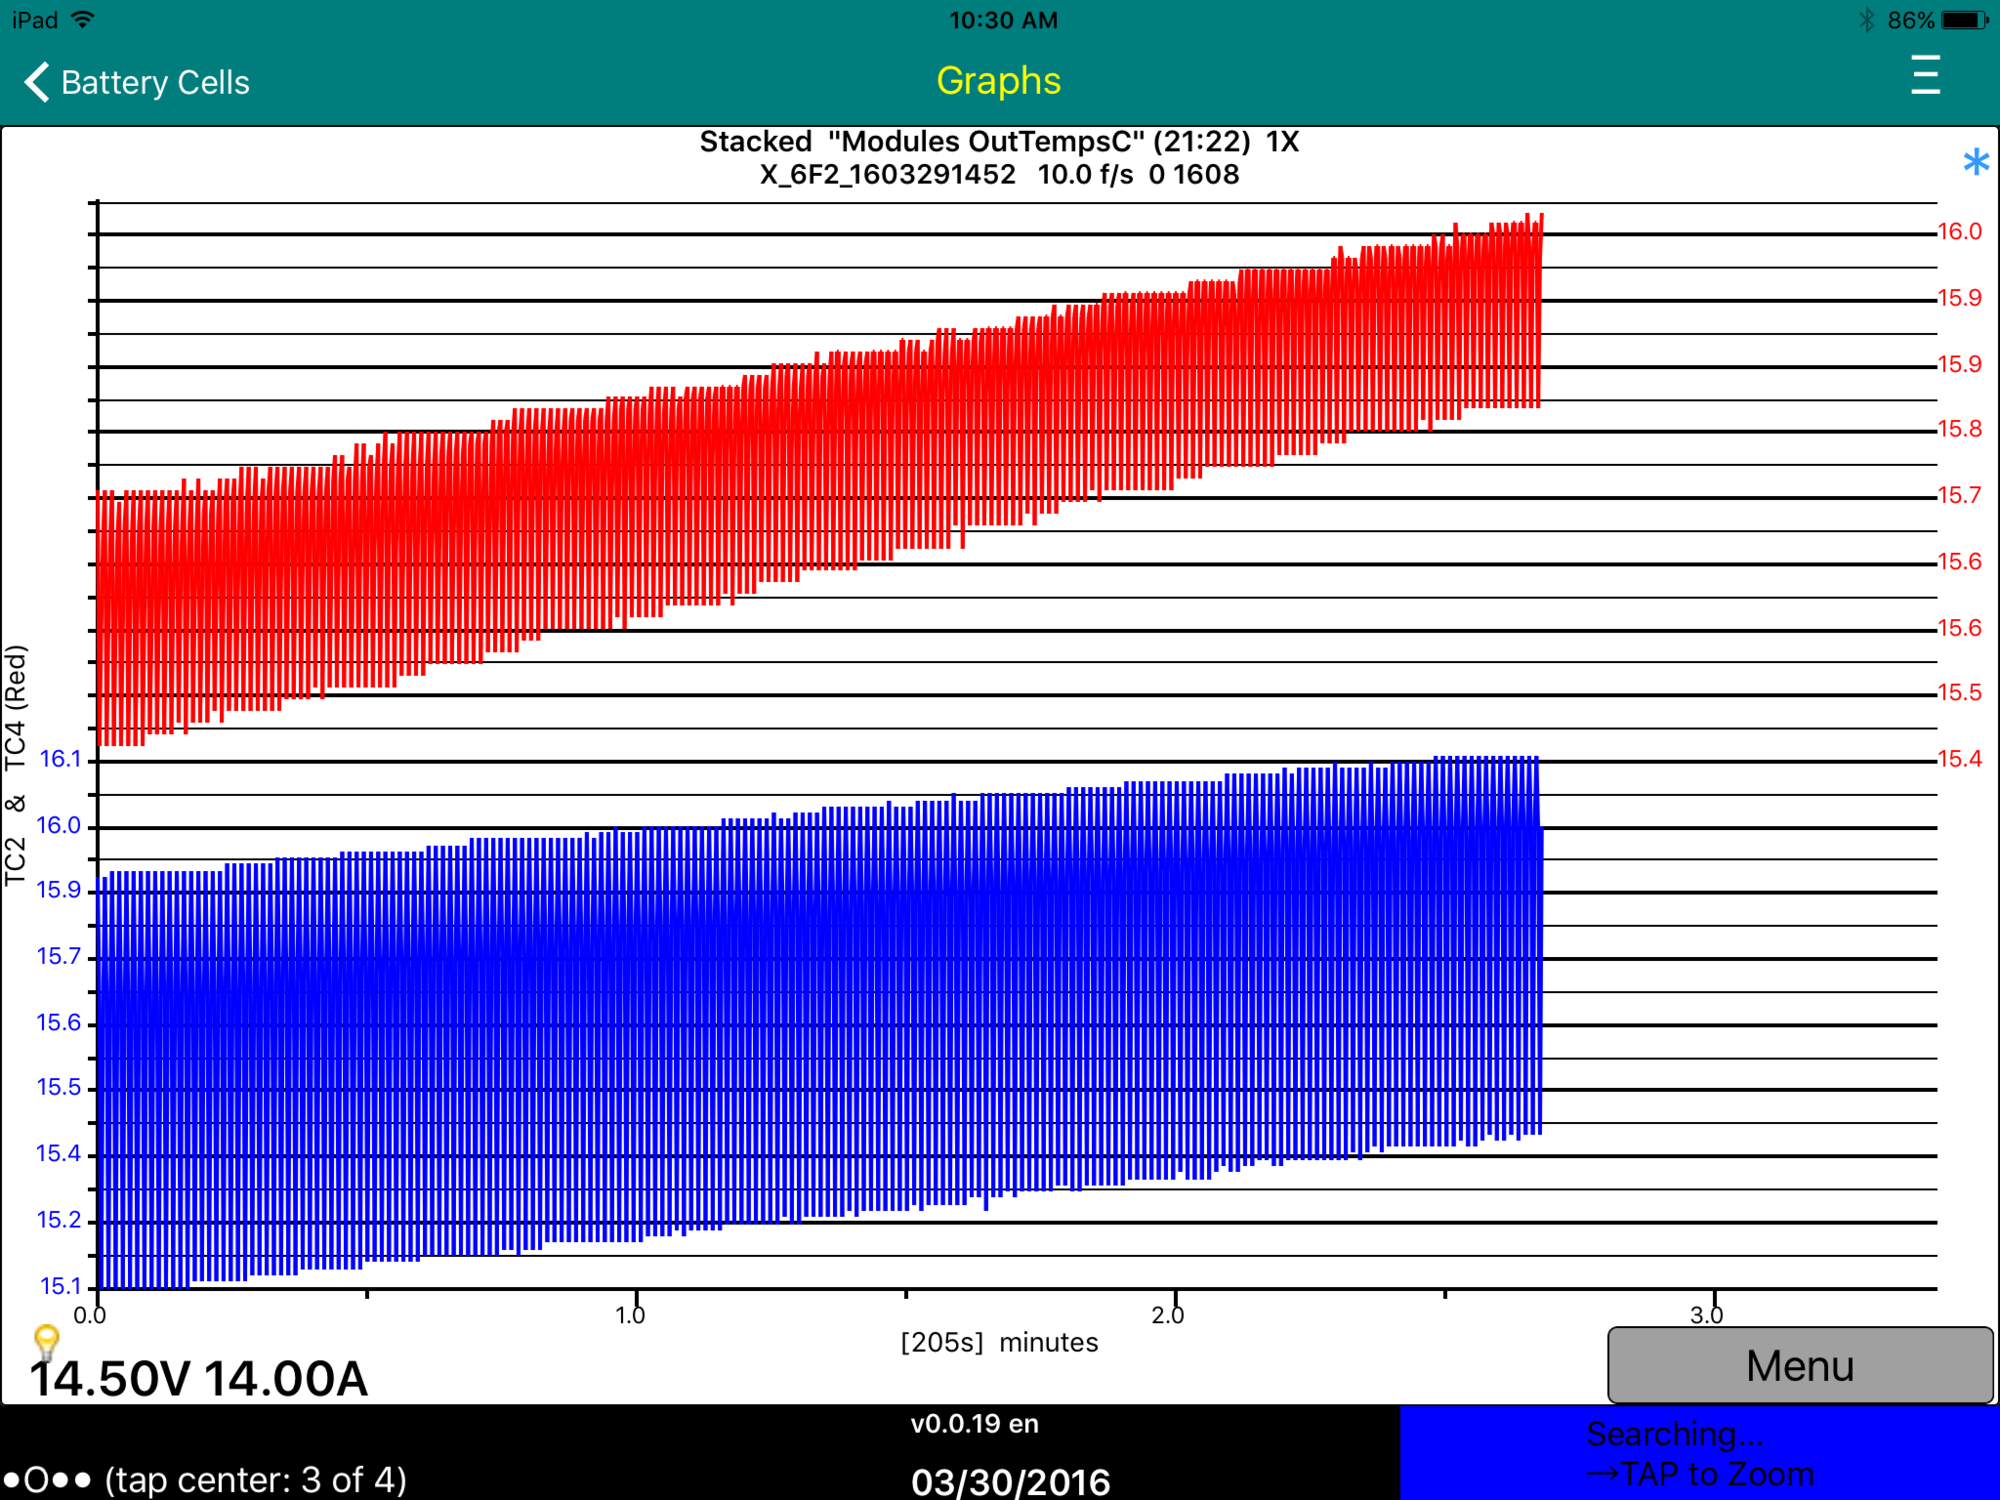
Then, Temperatures from the Outputs of all the Module (or so we assume):
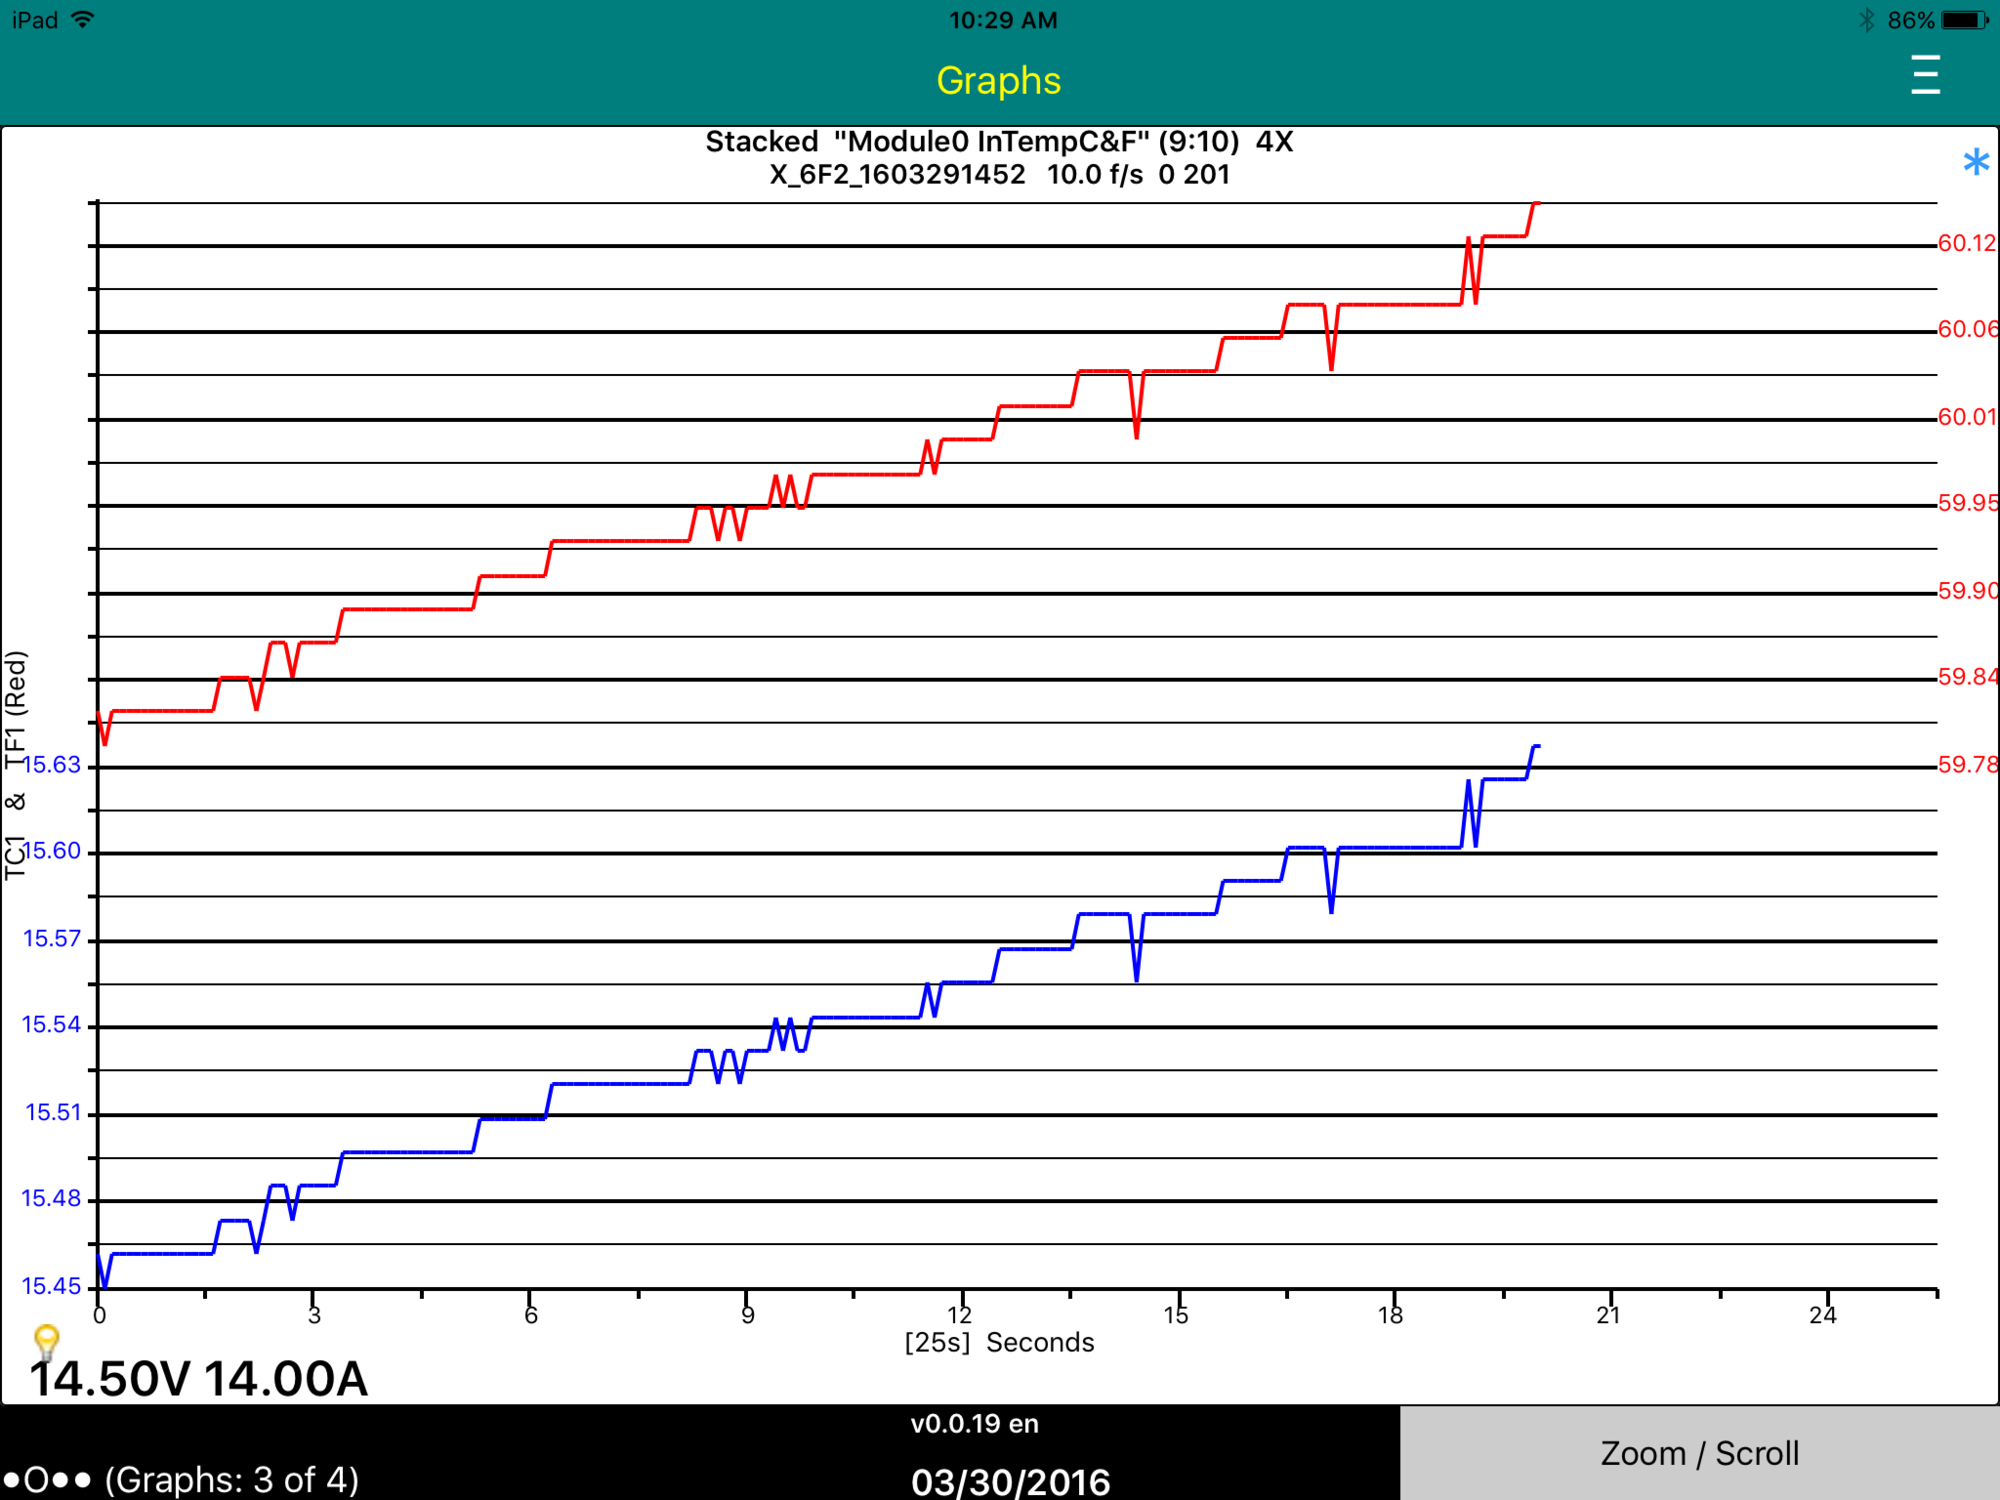
Temps from one Module's Input, shown in C and F (hopefully correct):
More later, need to feed and Rx my "puppy" (doggy) girl, and eat ...�
Mar 30, 2016
garygid oops ... using the bytes slightly backwards ...�
Mar 30, 2016
garygid The "Nocs" iOS app is quite a good and convenient app for viewing and editing your User Plots ("spyvarparmlist.csv") file that you would usually have in a Dropbox folder.
If others have better methods of editing, please let me know, since I am an iOS beginner. Thanks, Gary
Here is a link to what I think is a backup copy of my current User Plots ".csv" file in my Dropbox:
... testing ...
Dropbox - For TM-Spy
... what does this link do for you? I am just learning to use Dropbox. ... Thanks ...
If the link does not allow you to get a copy of the file, or if you find problems with, or errors in, the file, please let me know.
If it works for you to get a copy of the file, also let me know by someone posting here. Then, I will try to post some links to msgID log files (X_files) for you to play with offline, even if you cannot connect to a Tesla.�
Mar 30, 2016
Marcboy Guys is the low profile LELink dongle the one to get to join your gang ?�
Mar 30, 2016
garygid Yes, it is an OBD Bluetooth 4.0 (LE) dongle.
I bought this one. There might be others at better prices.
Amazon.com: LELink Bluetooth Low Energy BLE OBD-II OBD2 Car Diagnostic Tool For iPhone/iPod/iPad: Automotive
You also need a TDC to OBD Adapter.
Cheers, Gary�
Mar 31, 2016
Marcboy Thanks, is there a wiki on how to get started ?
Can I leave the dongle plugged behind the dash ?
Can I use an iPad to collect data while I drive, even if it only has wifi connectivity at home ?�
Mar 31, 2016
garygid No wiki, but read this thread from the start.
Yes, but above the cubby, not exactly behind the dash. Depends upon car age and console situation. But get it working first, then hide the dongle later.
Yes, the iPad only needs to connect to the dongle, via Bluetooth LE (4.0).�
Mar 31, 2016
Marcboy
Thanks,
I am reading this thread, and the other one. I have both Android phone, and iPad available. What would you recommend using ? Ipad has a bigger screen, so it seems better, if it is at feature parity�
Mar 31, 2016
garygid For now, the iOS app is much more advanced, and uses iPad 3 or later to support the Bluetooth 4.0.
The TM-Spy Android app, at the moment, is less advanced, and uses only (I think) standard Bluetooth via Pairing, so it needs a different ELM-type dongle. Later, it will catch up, and probably support the BT 4.0 dongle, as well.
So, for now, ride the crest of advancement ... try iPad if it is gen 3 or later.�
Apr 2, 2016
garygid There are two ways to get a User Plots file copied into the iOS app's working memory:
1. Use the iTunes program on a PC or Mac to Copy the file from that PC or Mac computer into the USB-attached phone or tablet app's appropriate private memory.
2. What I do with the iPad, to avoid using another computer: In my Dropbox account, I placed my User Plots file in the "Apps/TM-Spy/Copy to TM-Spy" folder. I enabled my TM-Spy app's Dropbox option in Settings, logging into my Dropbox account. Then, whenever I start the iOS version of TM-Spy from fully stopped, it will detect and download any current or later version of my User Plots file, the file named "spyvarparmlist.csv".
Note: I use the free "Nocs" iOS app to see and edit the text lines in my ".csv" file in my Dropbox. I have not found a suitable csv-file spreadsheet editor that will save the spreadsheet back in the "csv" format. Perhaps someone has a better suggestion?�
Apr 3, 2016
bollar I finally got the cable and it worked great. Impressive, actually, that no configuration was needed to make it work.�
Apr 3, 2016
jrreno Isn't Apple Numbers free? It saves in CSV using the send to command.�
Apr 3, 2016
garygid Numbers by Apple has many bad reviews, uses iCloud, but apparently not Dropbox,
so I do not want to spend $10 to try it out.
Does it have Fill Down, copy and insert Rows?
Any better suggestions, please?�
Apr 3, 2016
Turbo3 New release coming Monday (version 0.1.21 waiting for review by Apple).
Filtering, if enabled, is now done after capturing all the data so the same trace can later be plotted with a different filter and set of recipes to view data from other filtered frames. This removes the need for a separate "save all" recipe.
Here is the final Brick voltages plot with all the correct data and scales for both x-axis and y-axis. When viewing the other plot types when there are more than two plots tapping the right axis scale will switch the scale displayed to the other plot's scale and the color will change to match the plot color.
 �
�
Apr 4, 2016
markb1 It's free for newer devices (activated or purchased on or after 9/1/2013).�
Apr 4, 2016
garygid 1. The vertical axis (like the blue values above) often repeat one value twice, or skip a value, but the other three above APPEAR to be uniformly spaced.
Nice feature, that tapping the right-side axis values changes the axis values to show the scale of the same-color graph line, in the Full-Scale plot style.
2. The horizontal time axis still needs some work to make the uneven or too-rounded values match the evenly spaced tic marks, I think. Perhaps deciding upon evenly spaced values, and then drawing the tic marks to match would work better?
Version v0.1.22 exhibits both of these scaling problems in various different plots and different data.
But, the axis values are there in all the plots that I tested.�
Apr 4, 2016
Turbo3 That's just due to rounding when the number is displayed. If there were more digits you would see the differences.
==============
Here it is with a small adjustment to the scaling rules. Keep in mind an equation is used to generate these scales so all the values are evenly spaced. It is just the resolution of the numbers shown that makes it look like they are not. So you see what looks like skipped or missing values.
Time scale resolution increased so it looks more linear.
 �
�
Apr 4, 2016
garygid 1. Having some light tic marks on the left axis, to match the lighter lines, would increase legibility, I think.
2. The time axis could still use uniformly incremented values, associated with matching tic marks, right?�
Apr 4, 2016
Turbo3 Values are always uniformly incremented. It would require a lot of work to not make them uniform. It is only the rounding when they get displayed that makes them look not uniform. I have increased time scale resolution. Yes previous updated graph.
Version 0.1.23 will have these updates. Waiting for review by Apple.
A tick mark can only appear at the same location as a data point. The number of data points varies as you zoom in and out. One does not lay down a set of tick marks and then plot the data. As each data point is plotted a flag is set to place a tick mark or not. Those are the limits I need to work with.�
Apr 4, 2016
garygid The increased resolution helps a lot, very good.
lnteresting constraint ... how do the 27 and 30 tic marks get put into the graph below?

Cheers, Gary�
Apr 4, 2016
Turbo3 Each point gets loaded by calling a graph load routine with the x-axis value, data value(s) to be plotted and if a tick should be shown. I can load from one to N. For this app I limit N to 1200 or the maximum screen size whichever is smaller. The graph spreads the points out to fill the screen which is how zoom in works. I just plot less points which then get spread equally to fill the graph.
After all the points are loaded I call the actual graphing routine which draws to the screen with the y-scale values given (x-axis is known by the points previously loaded).�
Apr 4, 2016
Turbo3 Since the Graph routine always stretches to fill the screen I add the non-display value to keep that from happening when not zooming in. Those non display values are added to the end of the array to fill it out so 1200 or whatever the window size is set to always get displayed. Once they are in the array they get handled the same as any data to be plotted so include the x-axis (tick) information.
Version 0.1.23 is now available for testing.�
Apr 4, 2016
Turbo3 Here is a new feature I am testing out. G-force graphing. The bottom two plots are just test data but the top plot is real G-force with me shaking the iTouch. When the frames are saved two additional bytes with the G-force information are appended to it. To plot I added a recipe for the 9th and 10th bytes of the frame.
Will test in my Leaf tomorrow but I don't expect to hit 1G when I floor the accelerator. But should be interesting to see what I get.
There are three G-force values. I am just recording the Z-axis one so the iOS device needs to be placed with the back towards the front of the car. Other orientations are possible but would need a new Settings option to specify which to use.
(I see now I am going to get in trouble with my scale values again ;-)
 �
�
Apr 5, 2016
garygid Vertical and Horizontal scaling ... it looks like you have enough control to get the lines, both thick and thin, the tic marks, and the captions where you want them, but some formatting choices appear to be not quite optimal yet.
Dealing with Vertical axis scaling first...
The label / big-tic values should be a multiple of the least significant displayed digit, like 3.999 4.000 4.001 4.002 not values that get rounded to less than helpful 4 4 4 4 or some such.
For the data values you have take a pass at deciding how many significant digits should be displayed. Try for 3 or 4.
More on this later, but perhaps start with the "biggest" value, of max(abs(min), abs(max)) ...
If you graph G = 4 values, each with T = 5 big-tic marks, the the G-1 = 3 interior tic marks are shared, so there are H = T-1 = 4 intervals for each value, T tic labels for each value, and N*H= 16 intervals total. So, if the Max and Min of the value is to fall within its H-interval part of the graph, first round Max UP to the least significant displayable digit, getting RuMax, and round Min DOWN to the least significant displayable digit, getting RdMin. Caution when "rounding" negative numbers.
Then, the minimum interval size must be at least (RuMax - RdMin)/H = InvMin, round that UP to the next least significant displayable digit, getting RuInvMin. if RuInvMin is zero, add 1 in the least significant digit.
Now, if my thinking is not defective, you should have a usable interval with the data scaled as large as possible using displayable axis values, simply setting the first tic to RdMin is one, but not the only choice for "centering" the graph in the H intervals.
Taking (H x RuInvMin) - (RuMax - RdMin) = XtraSpace, then round (XtraSpace / 2) DOWN to get SpaceBelow. Finally, setting the first tic-value to (RdMin - SpaceBelow) probably centers the graph as well as possible in the vertical space available. Of course, each higher tic value is RuInvMin higher than the previous.
Hoping that this is helpful. Others, please correct me if I have made an error.�
Apr 5, 2016
Turbo3 Graph now supports independent resolutions for each plot y scale. This allows the G-Force plot scale to show increased resolution from the other two plots because it varies by less than 10 units.
 �
�
Apr 5, 2016
Turbo3 For the vertical axis the number of digits after the decimal point is set as follows based on the delta of the value being plotted when auto scaling and using the above version which is not released yet. For the previous versions the first plot set the format for all the others based on these rules.
Delta<0.1 format is x.xxx (ex 1.234)
Delta<1 format is x.xx (ex 1.23)
Delta<10 format is x.x (ex 1.2)
Delta>=10 no decimal point ( ex 23)�
Apr 6, 2016
garygid Very good to use the delta of each graph to set its resolution.
Thanks for the improvement.
You might consider a variation of your rules to show the tic values
more accurately, without losing anything, I think:
Delta<10 format is x.xxx (ex 1.234)
Delta<100 format is xx.xx (ex 12.34)
Delta>=100 no decimal point ( ex 123)
Perhaps you can apply the same resolution rules to the values shown on the time axis?�
Apr 6, 2016
garygid The delta can be small, but the values can be large, like pack voltage only changing by a half volt, so the delta is only about 0.5, but the values themselves are something like 395.501 to 396.003 ... where just using your delta rules might not work perfectly well.�
Apr 6, 2016
Marcboy Mm, so how do I install this app ? I can't find an app called to-spy on the store. Am I missing something ?�
Apr 6, 2016
thimel I think if you take the sum of the squares of the three g force readings, subtract one and then take the square root of the total you will get a net acceleration that does not depend on the orientation of the phone.
My reasoning (I have NOT verified this) is that the three g readings are for the three Cartesian directions. Pythagorean theorem says the total acceleration vector length would then be the square root of the sum of the squares. The minus one is to subtract out gravity. Note if the car is accelerating up or down hill, the formula will have a slight error.�
Apr 6, 2016
markb1 It's not in the app store. You need to ask Turbo3 to include you in the beta release. Once you get an invite, you'll be able to download the TM-Spy app via Apple's TestFlight app.�
Apr 6, 2016
Marcboy ahhh Thanks�
Apr 6, 2016
Turbo3 Gary,
It is probably easier if you just get B4
Yes, I was going to do that for the next version but had not looked up the formula yet
I got a nice panic stop recorded yesterday when a guy/gal made a left turn right in front of me. Have it on video too. Hit -1G with anti-lock kicking in. So I know my Leaf can do 1 G just like your Teslas (but in the opposite direction).
Busy with taxes so it will be a while before the next release. LeafSpy sales where too good last year and I need to go through my receipts to find all my expenses to try to offset it.�
Apr 6, 2016
Turbo3 Formula for vector is sqrt(x*x+y*y+z*z) which has been added to my test version.�
Apr 10, 2016
Turbo3 Version 0.1.24 is waiting for Apple's review.
Two bytes of acceleration data is appended to the end of each frame and can be plotted using bytes 9 an 10. Byte 9 is the high byte and 10 the low byte. Scale factor is 0.001 unsigned. Typical plot range would be 0 to 1.5 Gs.
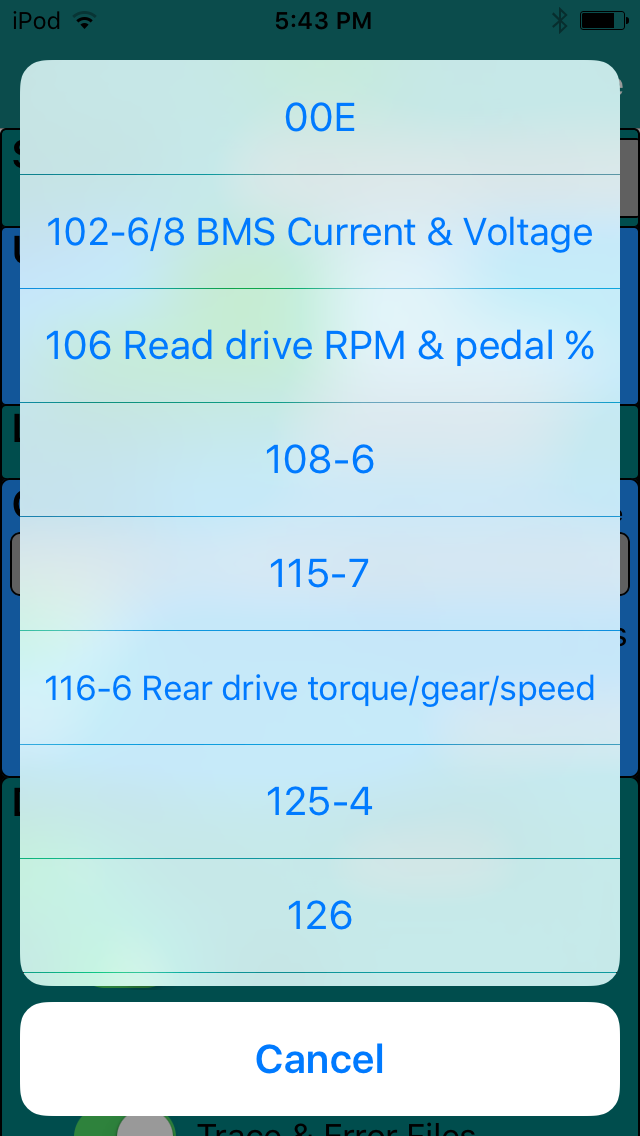
New universal MsgID of 0x800 can be used to match any frame data so one set of recipes can be used against any MsgID. Can also be used to allow selection of the MsgID used to capture frames to be selected from a list on the Settings/Options panel.
You can select from one of over 300 possible MsgID to capture. When capturing a MsgID for the first time it is helpful to know how many bytes it contains so you know what recipes to use. This can be done by turning on the Debug option at the bottom of Settings which will allow access to the Console. The Console will then be available to the left of the battery cell screen. While capturing a trace tap the "Connect" button at the top to monitor the frames in real time. Once a few frames are displayed tap again to stop displaying additional frames. Continuing to display new frames may impact the logging of frames so limit the use of this feature.�
Apr 10, 2016
garygid Mega-excellent additions, I will try them a little later this morning.
I installed a new Tesla software revision last night, presumably 2.16.17, but I will check in just a few minutes, and test to see that TM-Spy v0.1.23 still works, using a LELink Bluetooth 4.0 (LE) dongle that I tested last night just before I started the "upgrade". I will report how that goes.
Then, I will try v24 and its very cool, powerful new features.
Hopefully, if a Recipe refers to data bytes that do not exist in the data file, the Recipe will not crash, but just get zero or possibly 0xFF "pad-data" values for those missing bytes. For example, using a Recipe that wants bytes 7 and 8 on a msgID that has only 4 data bytes, or a Recipe wanting the new "acceleration" bytes 9 and 10 from an older data file.
If capturing a msgID with only 3 data bytes, do the acceleration bytes still get added as 9 and 10? If not, it might be necessary to pad the 3 bytes out to 8 bytes, perhaps using FF (or 00) pad-data values.
Ok, going out to the car...�
Apr 10, 2016
garygid Yes, the revision was 2.16.27, and my TM-Spy v0.1.23 on an iPad 3 connected and gathered data just like last night before the uodate.
So, a previous warning that this revision killed TM-Spy connectivity does not appear to apply to my car or to my LELink Bluetooth Low Energy dongle.
TM-Spy v0.1.24 is not yet available.�
Apr 10, 2016
Turbo3 Next release which should happen Monday morning is now 0.1.25. Includes code to pad all frames to 8 bytes by adding 0xFF to the end to fill it out.
User MsgID selection list now includes a short description of the frame information for known frames and the frame length if not 8 bytes long.
(Read Drive should be Rear Drive)
 �
�
Apr 11, 2016
garygid Wow, a list of the msgIDs included, Great Work Turbo3!
Is there a way for a user to enter a msgID that is not on the list?
Now, I am going to have to do a CAN-Do log of all the CAN3 messages,
including those while stopped, while driving, and during Supercharging.
Long overdue, but I will try to get a log this morning.�
Apr 11, 2016
garygid Since the messages 102:8 and 102:6 might have different data, or at least differently formatted data, and thus require different Recipes, I found that it was helpful to be able to differentiate the two "different" commands in my LEAF all-message log listings, so I included the one extra nibble (one hex digit in a text log) of information, the Data-Length (always 0 to 8 in real CAN messages) in my message-log files.
Although we might not need that here, just something to consider.
No, I think that I did not get the Data-Length included in Recipies in CAN-Do ... yet.�
Apr 11, 2016
Turbo3 No, I need to add any new MsgIDs to the code for them to show up on the list. Send any MsgIDs I have missed along with their length(s) and they will be added to the next release. If you know their function include a short description too.�
Apr 11, 2016
apacheguy What is 00E? I've seen it before but unsure of its meaning.�
Apr 11, 2016
garygid Double-Darn ... logging attempt failed.
I was in the car, hooked up my logging stuff, saw the flashing light on the AVR-CAN board that indicates CAN messages are being decoded ... and went to power on the laptop to start my CAN-Do program to actually capture the messages ... and the laptop's battery is apparently no longer holding a charge. About 30 seconds into the boot-up, the Vista laptop powered off.
So, maybe another laptop can run on its battery, I will have to check, and check to see if my 32-bit CAN-Do is fully capable on my 64-bit Win 7 laptop.�
Apr 11, 2016
Turbo3 After spending more than 3 hours being reviewed by Apple TM-Spy was finally approved. I have no idea what a reviewer would be doing for 3 hours unless they went out and found a Tesla, cable, LELink adapter and started writing recipes and taking traces.�
Apr 11, 2016
Benjamin Brooks Ha, I can definitely say no to that") �
�
Apr 11, 2016
Benjamin Brooks Sent to wrong thread?�
Apr 11, 2016
Turbo3 For those having trouble getting your VIN to show up I am thinking of adding a new option that will make the app sit and look for the VIN. When enabled, TM-Spy will wait until it sees the VIN which should take a maximum of 10 minutes. Only the battery odometer reading will be updated while waiting for the VIN to show up no other values will be updated like the battery cell voltages or temperatures.�
Apr 11, 2016
Turbo3 Not really, Gary is trying to capture all the Frame MsgID types to be sure I have them all listed for selection when using the User defined MsgID mode.�
Apr 11, 2016
garygid Testing v0.1.25 ...
The 0x800 Recipes are recognized in Settings, and your msgID list is ... long ... and I just got a log, of sorts, since it has some garbage because of the fast message rate, I think. Later, I will check the v0.1.25 msgID list against what I got with the car just sitting still.
When using Menu to Load data, the list of applicable Recipes comes up, and the 800-Recipes appear. Good.
However, when using Menu to just select a different Recipe, the 800's are missing ... a tiny oversight.
More later, Gary�
Apr 11, 2016
Turbo3 Fixed in the next release.�
Apr 11, 2016
jrreno That would be helpful if its not too much work. I have yet to see the VIN although I did get it with the Android version.�
Apr 11, 2016
apacheguy Um, why does one care about seeing the VIN in the app? It's listed in many other locations.�
Apr 11, 2016
Turbo3 Helps to identify screenshots (you can obscure the lower 4 digits for privacy if you want). The VIN can given an idea of the vehicle's age.
Potential future data collection feature will also make use of it.
And the most important reason: Because I can.�
Apr 11, 2016
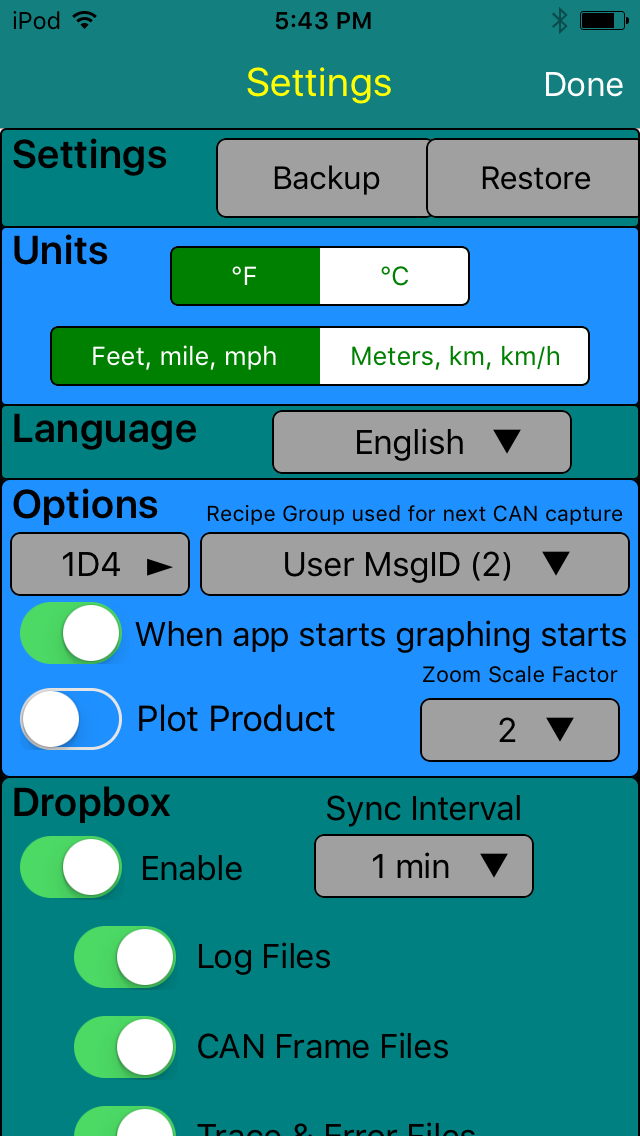
garygid In Settings, Options, ...
Consider making the msgid a longer box under the Recipe box,
thus showing most of the possibly long string for the selected msgid.
Then, make the Recipe box a bit longer, extending more toward the left margin.
And, then make the msgid box's length and position match the Recipe box.
Also, if a non 800 Recipe is selected, show its msgid (and possible description) in that box,
then the msgid box always has helpful information, and it does not have to vanish.�
Apr 11, 2016
Turbo3 Just uploaded the next test version with the new "Wait for VIN" option. I would be interested in hearing how this works and when enabled does the VIN show up within 10 minutes.�
Apr 11, 2016
garygid Thoughts ...
1. In the future, when using TM-Spy offline, one of our files could be a Log file, and
"data collection" could be done from that file, instead of from the live CAN bus.
2. Initially the Log file could be of CAN3, but eventually it could be from one of the other CAN buses.
3. Similar to the Built-in Plots (Recipes) file being extended by the UserPlots file in Dropbox,
the builtin MsgID file could be extended by a UserMsgID file in the same place, loaded at the same time.
This would allow the user to better document any msgid discoveries, share them with friends,
and eventually send them in as candidates to become part of the builtin msgid file.�
Apr 11, 2016
garygid If one defines a Plot for acceleration (bytes 9 and 10), and uses it on a data file that does not have data bytes 9 and 10 appended, the v0.1.25 app appears to use ... maybe the D1 and D2 values (perhaps at k-8) ... is that the intended operation?
Would using the value zero (or 0xFF) be less confusing to the user?�
Apr 12, 2016
Turbo3 If you try to access bytes that do not exist the app will crash.�
Apr 12, 2016
garygid Strange, when I selected Menu, Load, and then selected a new UserPlot that graphs data bytes 9 and 10, the v0.1.25 app appeared to draw some data, like perhaps D1 and D2, and not crash ... I guess I will have to try again ... or wait for a fix?
However, you are right, when I stopped the app and attempted to restart it, it just crashed, and I had to uninstall and then install the app again. Presumably, if the only frame data file was an old msgid with only 3 data bytes, and the builtin Power Plot was used by default ... the app would crash again. But, a fresh install has just a 0x102 frame data file, which is captured from an 8 data byte msgid, so the app restarts ... good.
Strangely, after the re-install, only the one default frame data file is available to Load. Isn't the app supposed to copy down the frame files from dropbox after it is enabled and restarted? The app does download my UserPlots file, but apparently not the frame data files from Apps/TM-Spy/Frames/ ... what am I missing?
Perhaps "Sync Interval" means Upload Interval, not really Sync (Upload and Download) for the frame files?
Thanks, Gary�
Apr 12, 2016
garygid In v0.1.25, are the frames in old frame files padded to 8 data bytes after they are read, or are the individual frames just padded to 8 data bytes before being written to a new file ... possibly with the new acceleration bytes appended?
Eventually, would there be an option to Not Append Acceleration?
In Settings, the "When app starts graphing starts" label probably means "Auto-Start Data-Gathering" (when the app starts) ... so data-gathering, not graphing perhaps, as space and font size permit?�
Apr 12, 2016
garygid When looking at the Data-Gathering frame (4 of 4), after going to Settings and choosing a new Plot, the chosen Plot does not get reflected into the top title line of the data-gathering page, ... except perhaps the very first time, when I thought that my selections in Settings did appear.
The selection of a new msgID in Settings does cause an update to the second line of the data-gathering page, so perhaps both lines should just be handled and updated together, like is done with the second line?�
Apr 12, 2016
Turbo3 The top line reflects what you are looking at on the graph at the moment so will not be updated until you take another graph. The second line says "Ready to graph..." so is telling you what you will graph next. They will only be in sync when capturing data or after capturing data and you have not gone into settings and selected a different frame to capture. Just because you go into settings and change what you want to graph next that does not change what you previously graphed and have displayed on the screen.�
Apr 12, 2016
Turbo3 If you are looking at old data that has less than 8 bytes it will be considered an error and be padded to 8 bytes with an error message displayed on the console. No plan to make acceleration data optional. I would need to pad the bytes anyway so why not just add it. If I don't add it you are going to use a recipe that wants it and then want me to handle that case in some special way. So I avoid having that special case by just adding it.�
Apr 12, 2016
Turbo3 Downloading from the Copy to TM-Spy does not depend on the Sync Interval. Just press the Home button then select TM-Spy to start the download again. It might take some time to download all the files if there are a lot of them.
Wednesday's release will pad all frames to 10 bytes but this is done on the fly while graphing so will add additional time. These old graphs should be replaced by taking new ones that have all 10 bytes of data.�
Apr 12, 2016
garygid Replacing old data is very time consuming, and reconstructing the old circumstances that were carefully logged is essentially impossible to do.
It would be relatively easy to add a function to "Standardize All Frame Files" preserving the user's carefully gathered data. Loading each frame file, doing the padding if needed, adding zero acceleration bytes if needed, and writing out to overwrite the same file ... would be very helpful, please.
Also, when Loading any frame data, seeing unpadded message data bytes and/or missing acceleration bytes could trigger a message "Standardize this frame file Now? Yes ... or ... Don't Use" would help keep all your internal checking to a minimum, and have all the fixing in one spot. Doing an app Update would trigger the requirement to re-Load any Frame file in use, just in case the Standards have changed.
The data-gathering page says "ready to gather", not ready to graph. When the gathering page is empty, cleared, and shows no data, one can change the Plot, but Settings still says that the "recipe group for next CAN capture" is something else ... somewhat confusing to most users, I suspect.
However, great progress.�
Apr 12, 2016
garygid To restore my frame files after an uninstall and fresh install, I need to do basically these steps?
1. Stop the TM-Spy app
2. access Dropbox and copy all the frame files from Apps/TM-Spy/Frames/ to Apps/TM-Spy/Copy to TM-Spy/
3. Start the App ... the copied frame files would be downloaded
4. probably pause the app
5. access Dropbox and erase all the frame files that I just copied, in case the app Standardizes any of my frame files ... but be careful to NOT erase my UserPlots file.
6. probably close Dropbox
7. continue using TM-Spy
Just checking to see if that is what you intend, Thanks.�
Apr 12, 2016
Turbo3 Tomorrow's release will allow TM-Spy to run in the background when using Bluetooth. This way you can use your iPhone for other things while still collecting data.�
Apr 12, 2016
Turbo3 TM-Spy will not copy down a frame file that already exists in the TM-Spy folder on your iOS device so no need to erase them from the Copy to TM-Spy folder.
It may take some time between copying files into the Copy to TM-Spy Dropbox folder until they are actually seen by TM-Spy. It takes time for Dropbox to sync everything up.�
Apr 12, 2016
Turbo3 As I said tomorrow's release will handle short frames. There is just a speed penalty in padding out the short frames.
I will look into handling the case of no current graph and allowing the recipe selection to be immediately seen on the first line.�
Apr 12, 2016
apacheguy Anyone know? I ask because I see it in the screen grab in post #161 and thought someone would know the answer.�
Apr 12, 2016
garygid The msgID 0x00E is one of over 300 msgIDs that have been observed on the Tesla's CAN3 bus ... most that we know little or nothing about. The msgIDs that you see in post #161 are just the beginning of a very long list of the observed msgIDs, subject to corrections as we learn more. Those on the list that we know something about usually have a short description included there.�
Apr 12, 2016
Turbo3 The version with the special VIN read mode is now available for testing.�
Apr 12, 2016
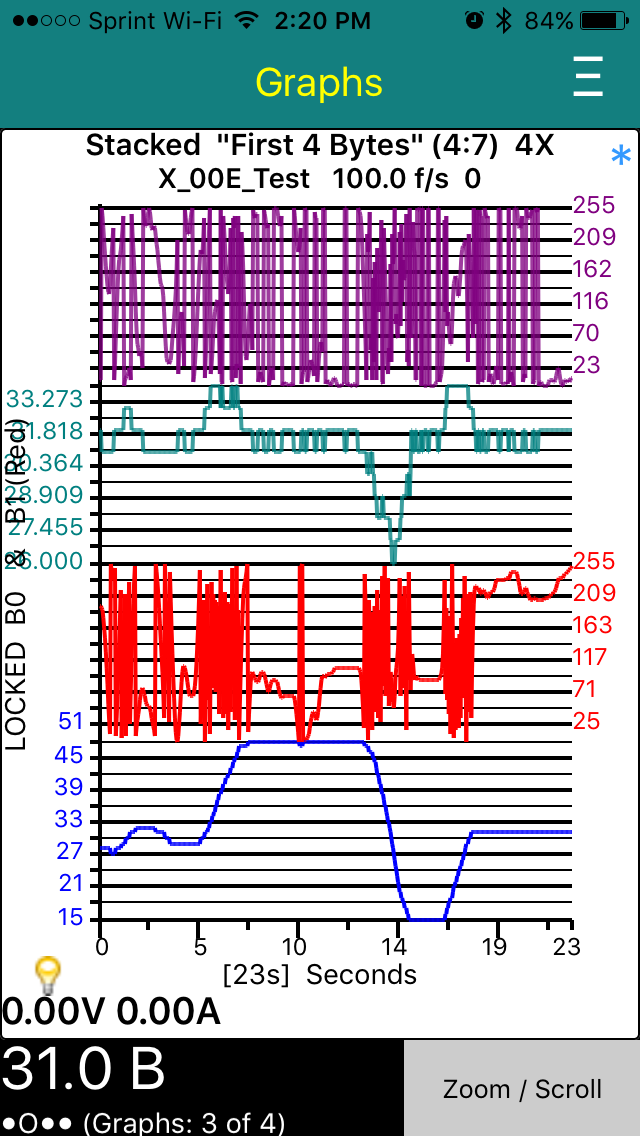
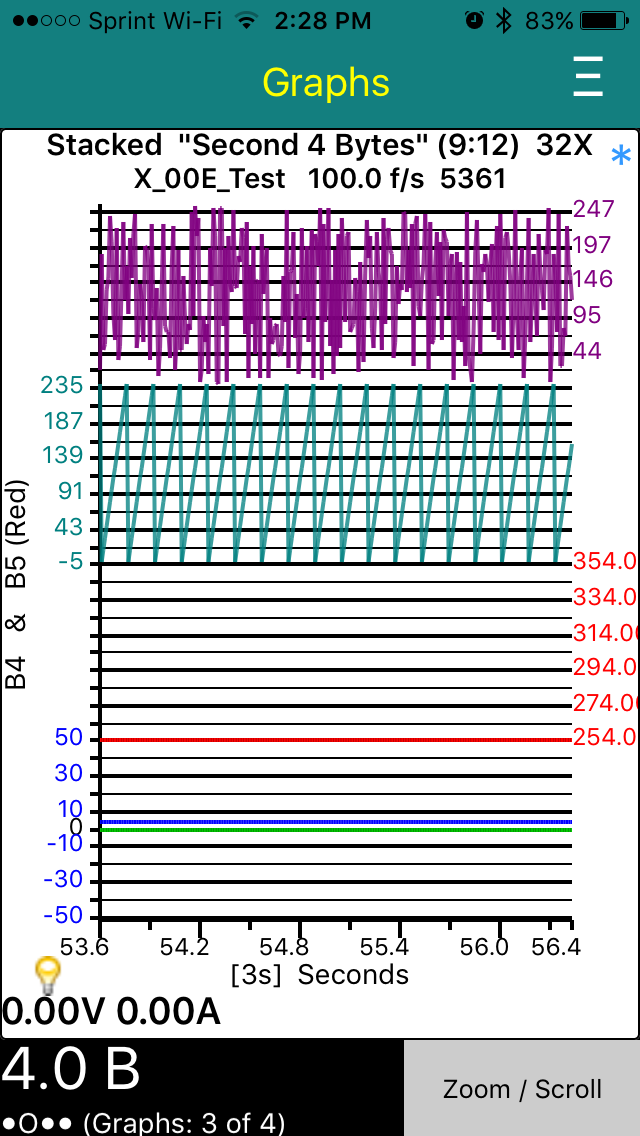
Turbo3 Don't know what it does but here is a trace of the first four bytes. I made up two universal plots. The first plots the first four bytes of a frame and the second the second four bytes.
There is something strange happening with the scale of the third byte I need to look into.
Here are the second four bytes. You can clearly see a counter in the seventh bytes. The fifth (B4) and sixth (B5) are constant value (0x04, 0xFF).
 �
�
Apr 12, 2016
garygid Suggestion:
On the "Graphing Saved Data" screen (3 of 4), in the Menu, it would be very helpful to have a "Show Plot's Recipes" function that would do a wide semi-transparent overlay containing the csv text of the current Plot's Recipe(s), perhaps only in landscape mode.
The overlay background would be sufficiently transparent to see a reasonable ghost of the graph behind it, yet sufficently opaque to be able to read the text of the recipes. Then, a screenshot could show, if desired, both the data graph(s), and the Plot that produced the graph(s).�
Apr 12, 2016
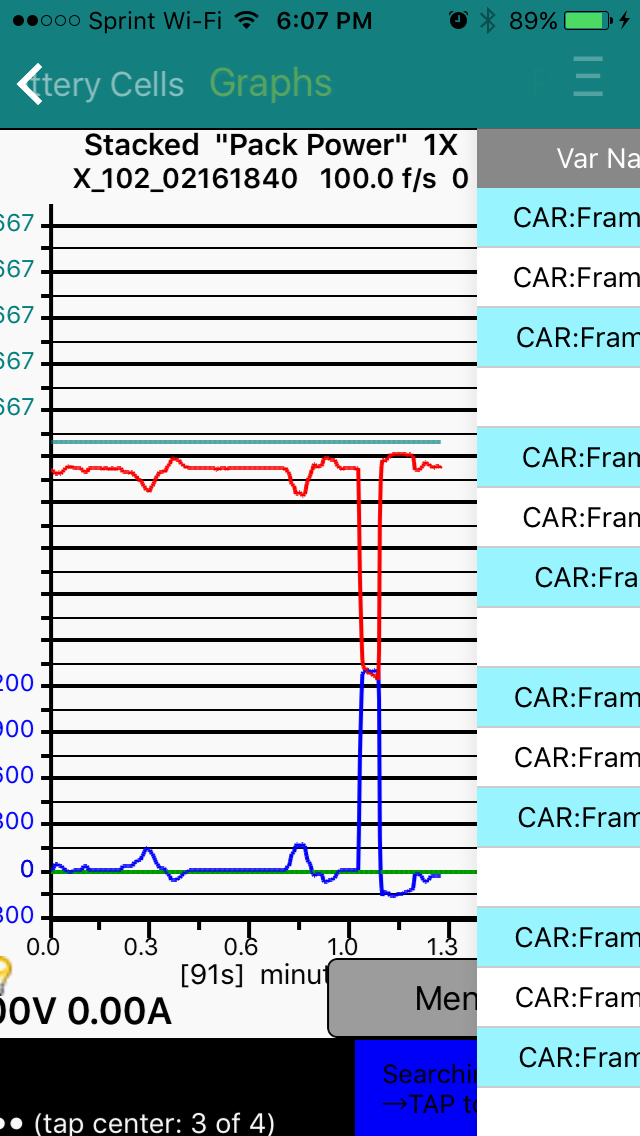
Turbo3 There will be a separate View Recipe option. I will need to modify the Table viewer to include the line numbers in the file.
You can slide the table to the right to get a peak at the graph.
 �
�
Apr 12, 2016
jrreno I turned on the VIN watch mode and started watching at 9:46
�
Apr 12, 2016
Turbo3 Was your Tesla turn on? Ready to drive.�
Apr 12, 2016
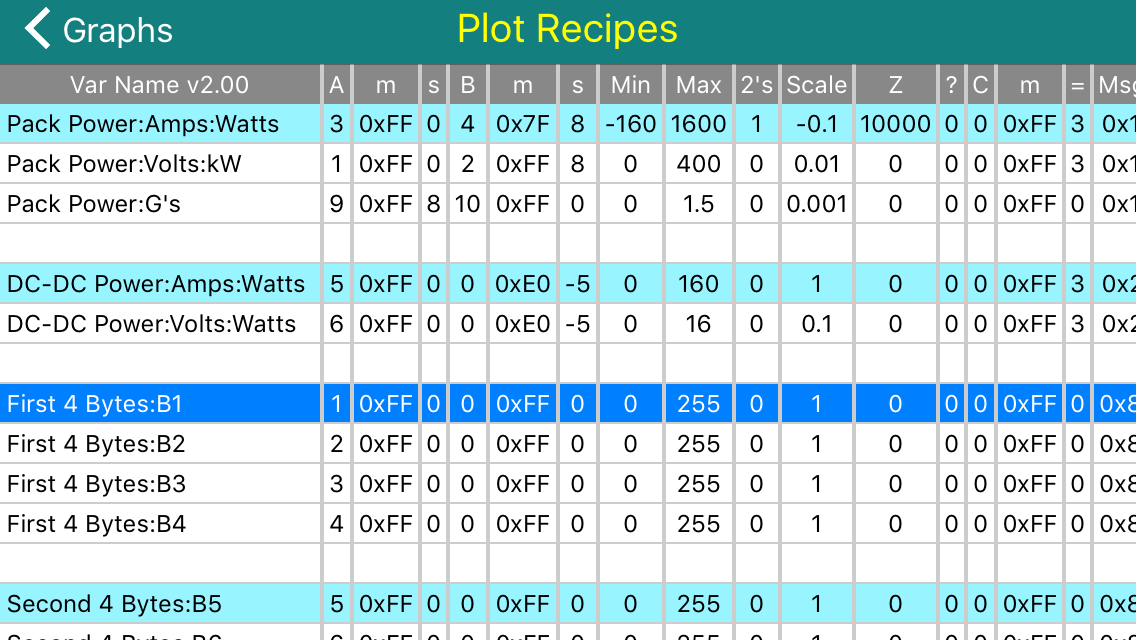
garygid The Plot Recipe Table will be a great addition.
However, I was hoping for a different feature. Something much more compact horizontally, just showing the one Plot in use to make the graph. Perhaps the csv text broken into 3 parts like the example below, semi-transparent and superimposed over the graph, so that it could be included in a screenshot of the graphed data for better documentation of the data.
Another use ... if you know what specific Recipes were used to graph the data, it might be easier to tell if the scaling is being done properly.
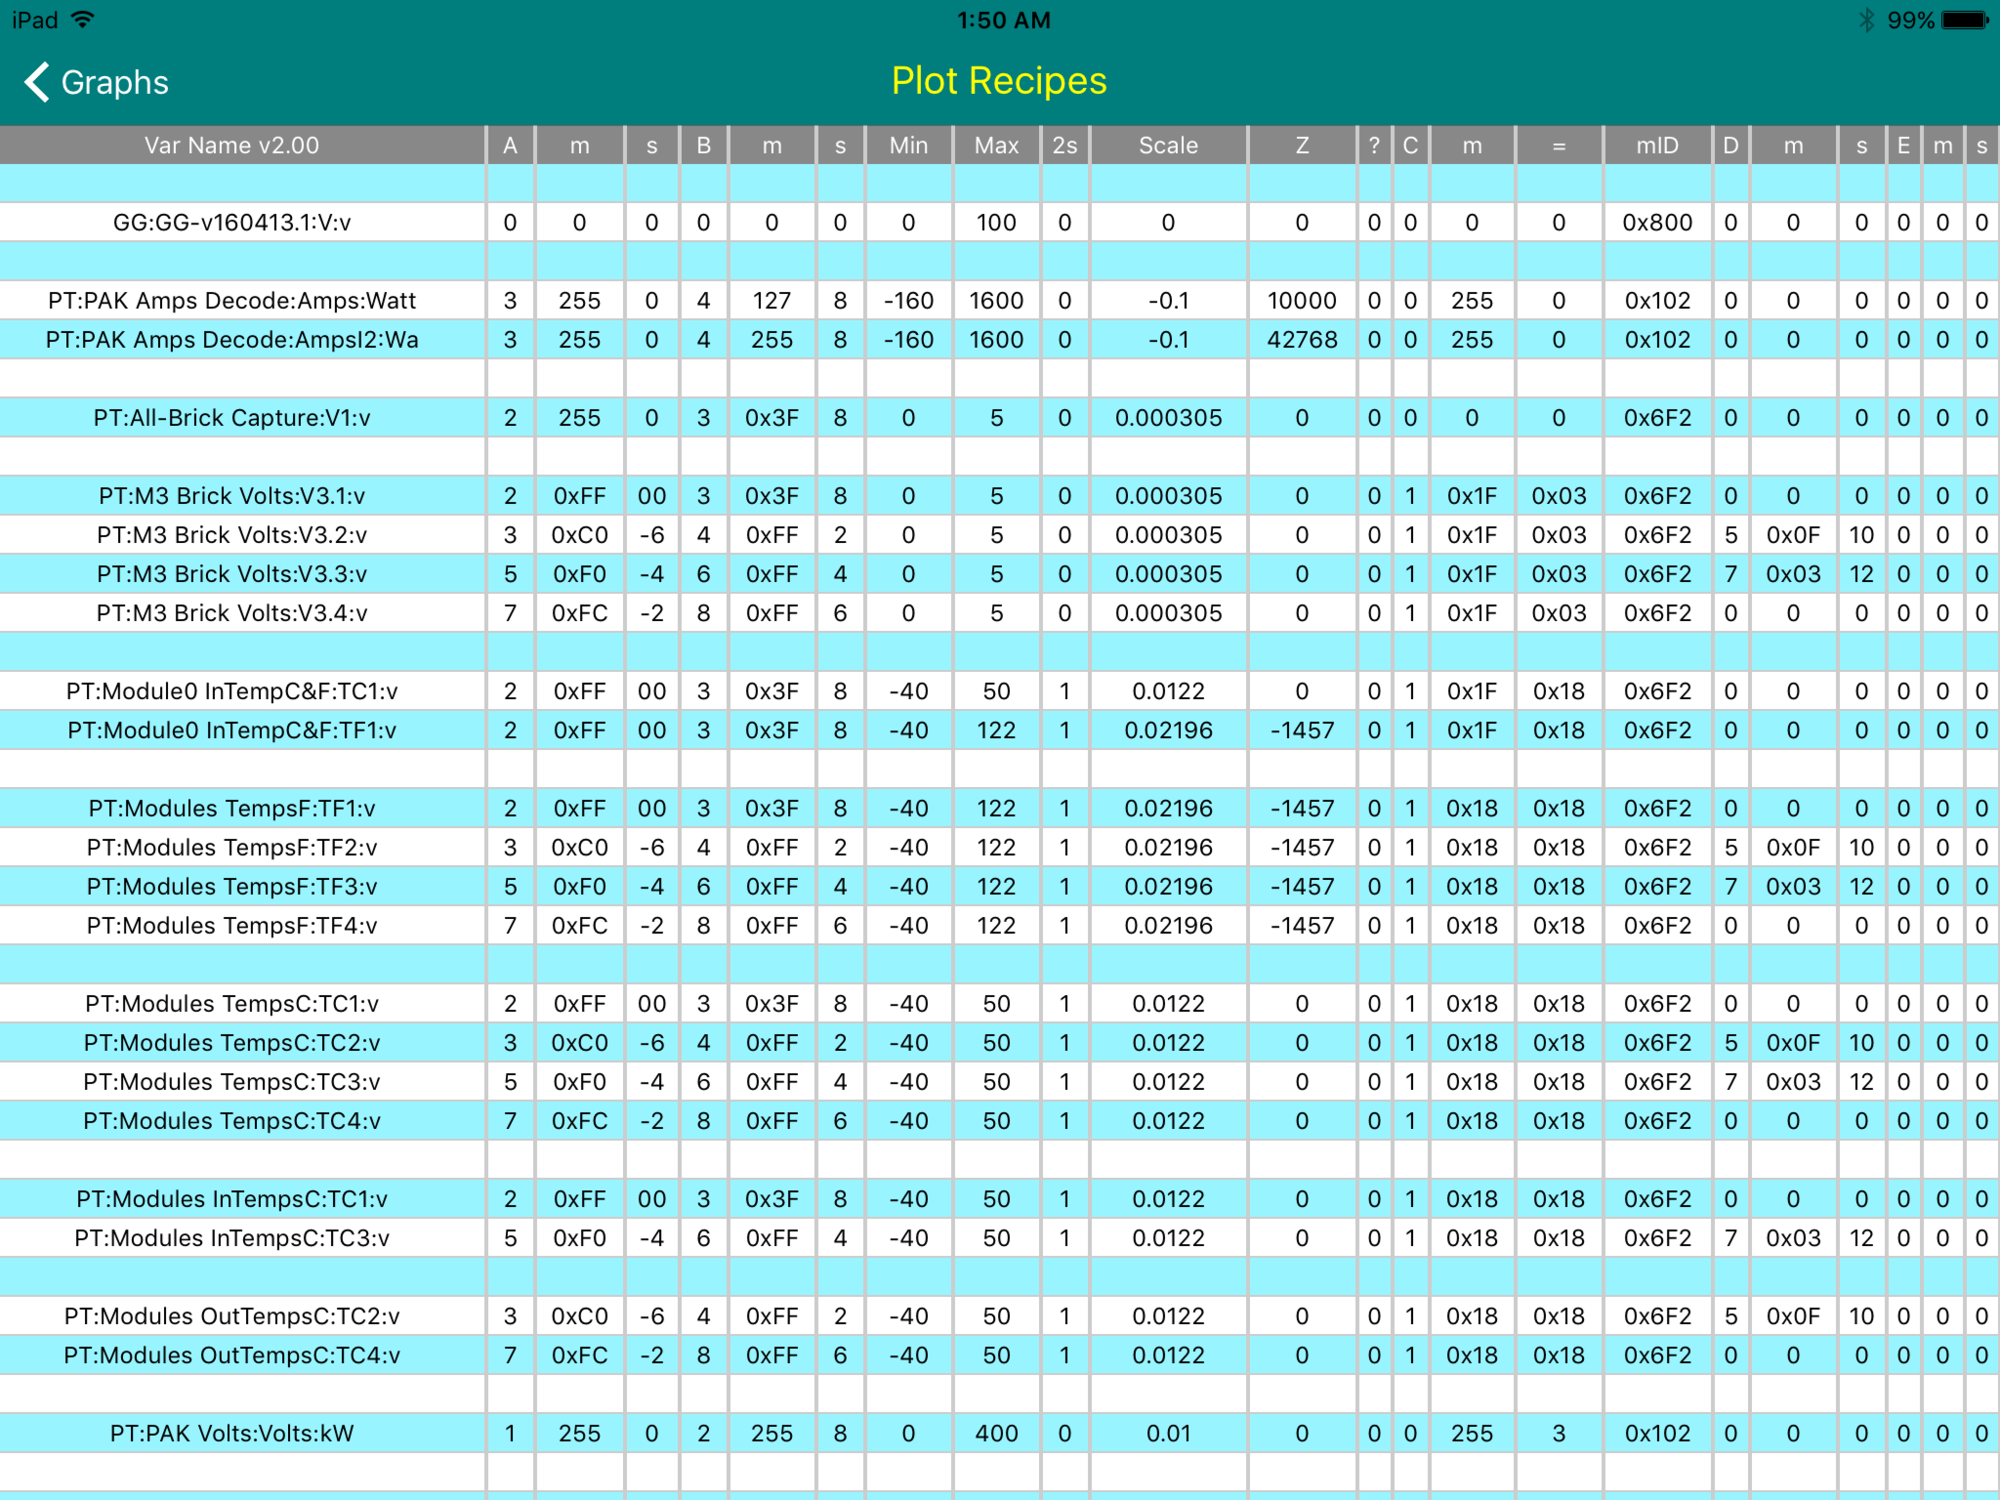
(49,50) PT:Module0 InTempC&F:
>TC1:v,2,0xFF,00,3,0x3F,8,-40,50,1,0.0122,0,
0,1,0x1F,0x18,0x6F2,0,0,0,0,0,0
>TF1:v,2,0xFF,00,3,0x3F,8,-40,122,1,0.02196,-1457,
0,1,0x1F,0x18,0x6F2,0,0,0,0,0,0
Perhaps something for the future, where setting the text size used might be a Settings option.�
Apr 13, 2016
Turbo3 Sorry, that is just not readable.�
Apr 13, 2016
garygid Data Sluthing 101 - Recognizing the High and Low bytes of a multi-byte variable:
In the first screenshot in post #196, note that the first byte (D1 or B0 in blue) appears to be the high order byte of some variable (V1), possibly correlated with some aspect of driving speed. The second byte (D2 or B1 in red) just appears to be "noise". However, looking carefully at the parts of D2 that occur when the first byte is mostly flat (not changing very much) we can see that the "noise" appears to be noticably less during those intervals. That is a strong clue that the second byte is the Low-order byte of a two-byte variable.
Sometimes two-byte variables are used when the measureable range and resolution of the data requires more than the 255 levels that one byte can represent. Two bytes gives one about 64,000 levels. Usually, the two bytes are adjacent in the message data bytes, but not always. In this case, the High-order byte is first, and the Low-order byte in next. Sometimes the Low-order byte comes first.
Looking at the next two bytes, notice the much shorter flat intervals of D3 match the less-noisy parts of D4. So, we can be fairly sure that D3 is the high byte and D4 the low byte of a different variable (V2).
Then, note that the peaks of V2 occur when V1 is changing rapidly, with V2 peaks up for rising slope of V1, and downward "peaks" of V2 for the falling slopes of V1. If V1 is related to a speed, like RPM, or even an accelerator pedal position, then V2 might be related to acceleration, like power, amps, etc.
The D5 and D6 appear to be nearly constant, but one cannot tell if they are actually constant at the graphing scale used for them. If they were 0 and 255 that might indicate that the bytes are unused, or that they might contain flags that are not changing at the moment.
The byte D7, as Turbo3 mentions, appears the be a "time" related counter, with approximately a 0.2 second perioid (according to the 4x scale captions, but those might possibly be misleading), perhaps counting milliseconds, with use unknown at this point, but perhaps part of a multi-byte counter elsewhere.
D8 is unusual. It could be the lowest byte in a high resolution 3-byte variable, or ... just unknown for now.�
Apr 13, 2016
garygid That text seems to be quite readable on my LG G3 Android smartphone, and very readable on tablets and the rather huge iPad, ... but perhaps not on some older, lower resolution phones?
Or, perhaps you mean not understandable ... to most humanoids?
But, the text would be meaningful to you and anybody directly editing csv files, right?
Or, am I not understanding correctly?
Thanks�
Apr 13, 2016
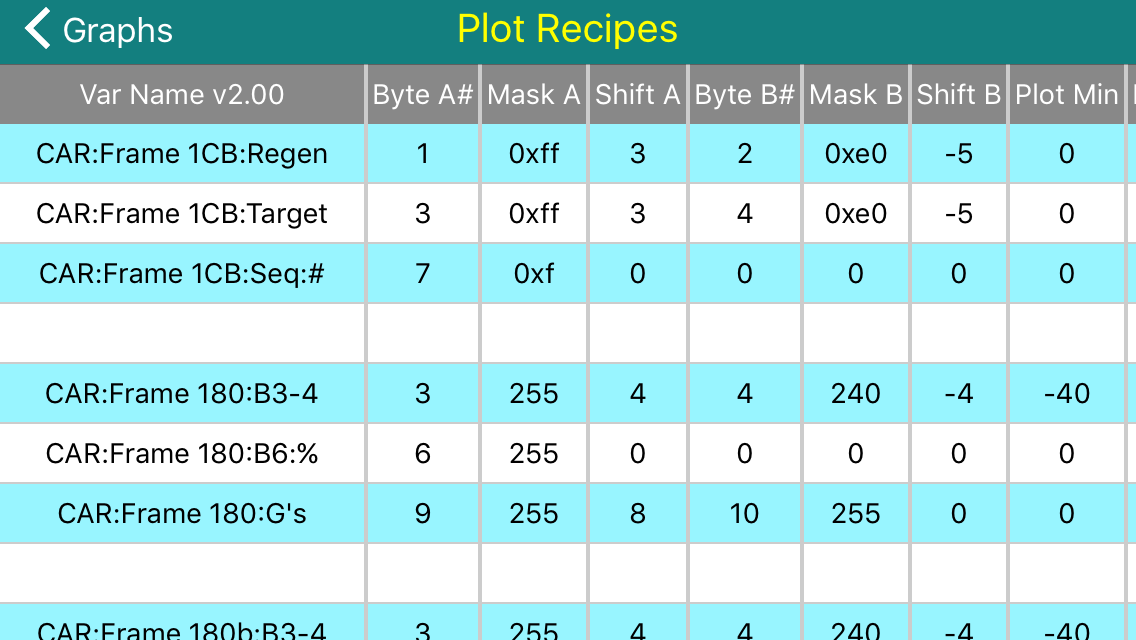
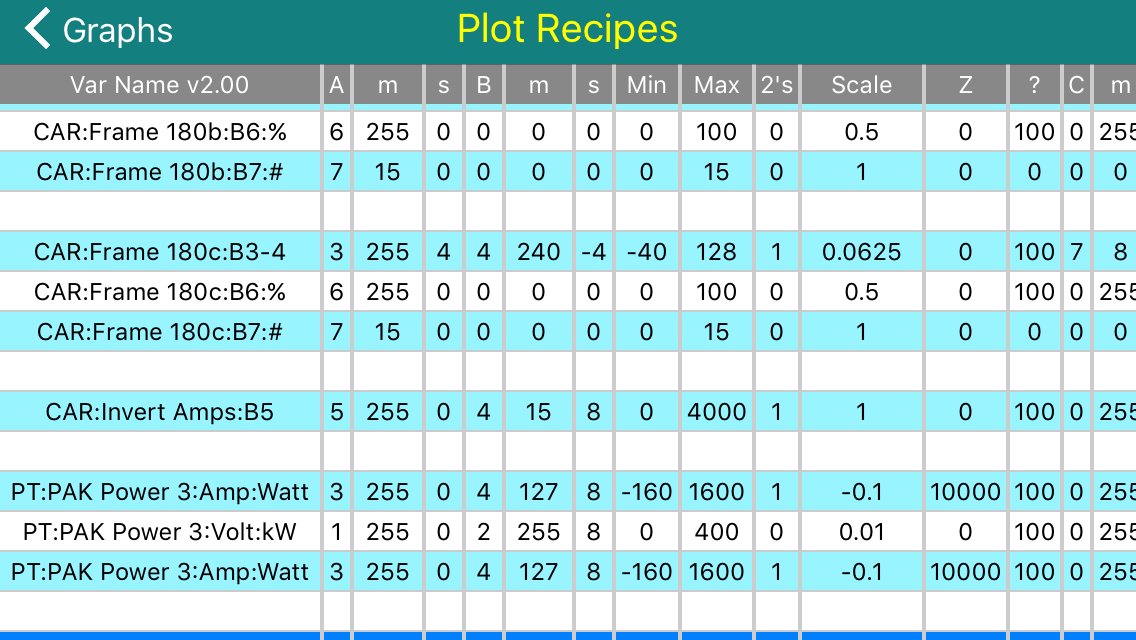
Turbo3 Version 0.1.28 was just uploaded and includes the new view recipes function on the menu. By reducing the Header text you can make more columns of data visible on the screen at one time. Depending on how long it takes the reviewer it might be available by late afternoon PDT.
 �
�
Apr 13, 2016
Benjamin Brooks Any chance these recipes will be included by default? If not, is there a good place (i.e. server) somewhere, or perhaps on TMC wiki, that's maintaining a master recipe list?�
Apr 13, 2016
markb1 This would be great. I would suggest adding a wiki to this thread (I think that's still a forum feature) to keep it all in one place.
This thread has gotten really difficult to follow. I think I need a very simple tutorial on how to use this app. I know the app is rapidly changing, but I'm finding I can't effectively test the app because I don't know how to use most of its features.�
Apr 13, 2016
Turbo3 The 180 frames in the above recipe file are for my Leaf so I can test the app.
Looks like I might be on the fast track for release. Currently being reviewed.�
Apr 13, 2016
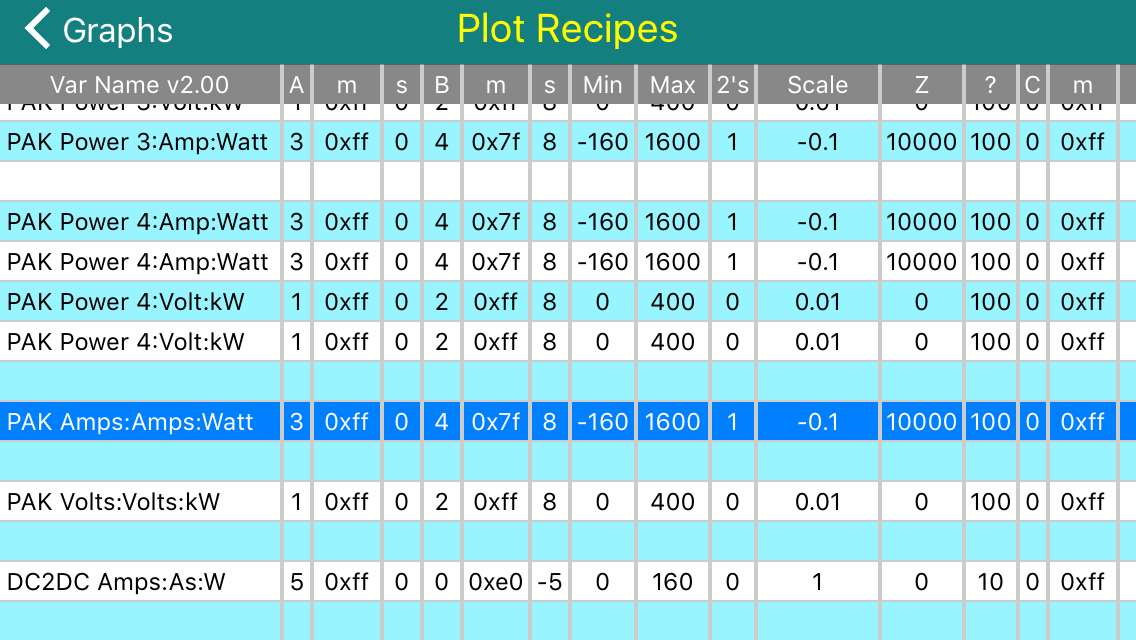
Turbo3 Minor adjustment for next version. First column will be forced to Left Justification.
On iPad with first part of name removed.
 �
�
Apr 13, 2016
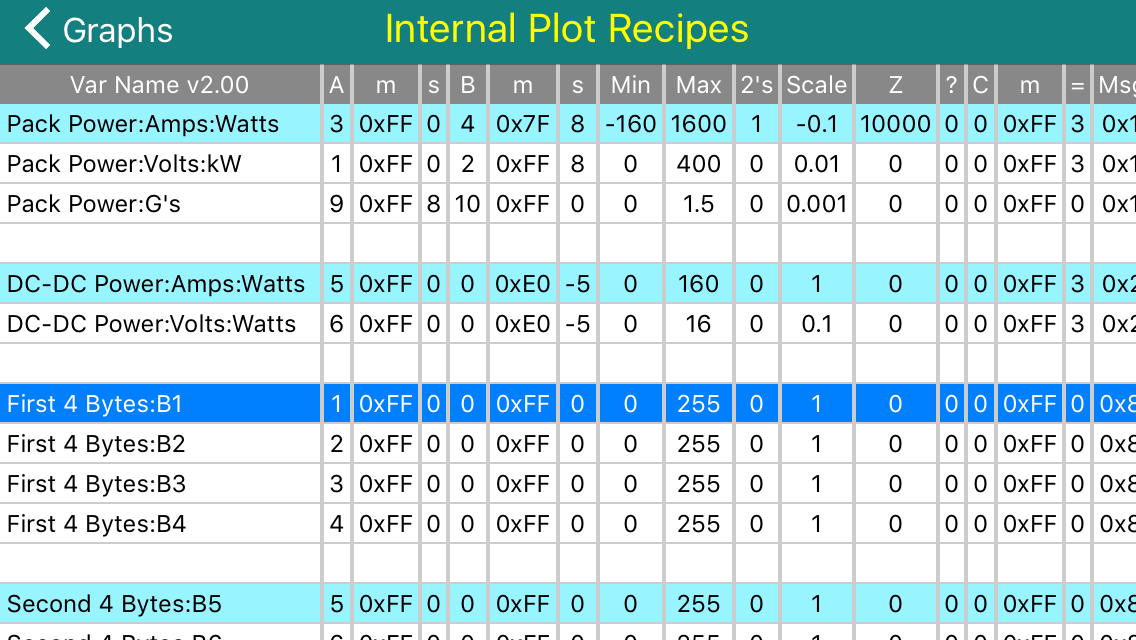
Turbo3 To make the selected line text easier to read the text color was changed to white instead of black.
 �
�
Apr 13, 2016
garygid Apparently v0.1.28 only shows the Standard Plots, and not the User Plots.
Then, if a User Plot is in use when View Recipes is selected, the app crashes.
Probably showing both the Standard Plots and the User Plots was intended?
This version has the wide column headers in the Recipes table.
I do not see any blank lines between the Plots ... like you show above.
You might consider making the first line of each Plot the light blue, instead of every other line.
Using D1 through D8 instead of B0 through B7 in the Plot names and Variable names might be less confusing, to better match the Byte numbers in the recipes, which are 1 - 8?
Highlighting a Recipe in the table currently seems to do nothing.
Perhaps, in the future, we would be able to edit the highlighted User Recipe?�
Apr 13, 2016
garygid A copy of my User Plot file (spyvarparmlist.csv) should be available using this Dropbox link:
Dropbox - Public
***** NOTE: USE AT YOUR OWN RISK. *****
Please let me know if this link works, or not.
I need a not-me person to test getting the file.
Thanks, Gary�
Apr 13, 2016
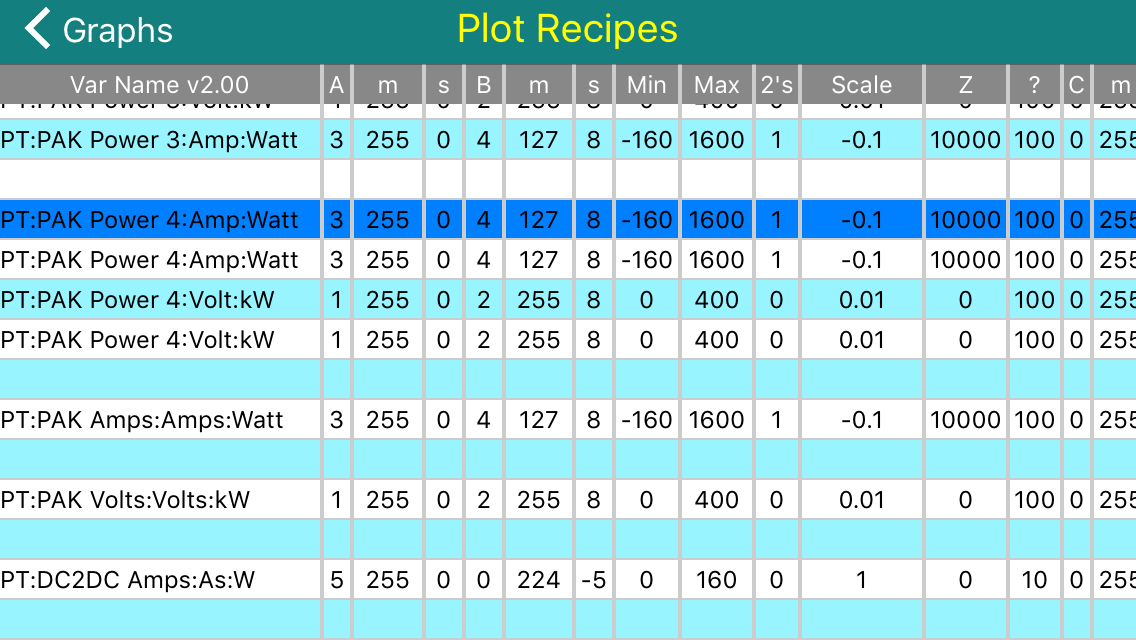
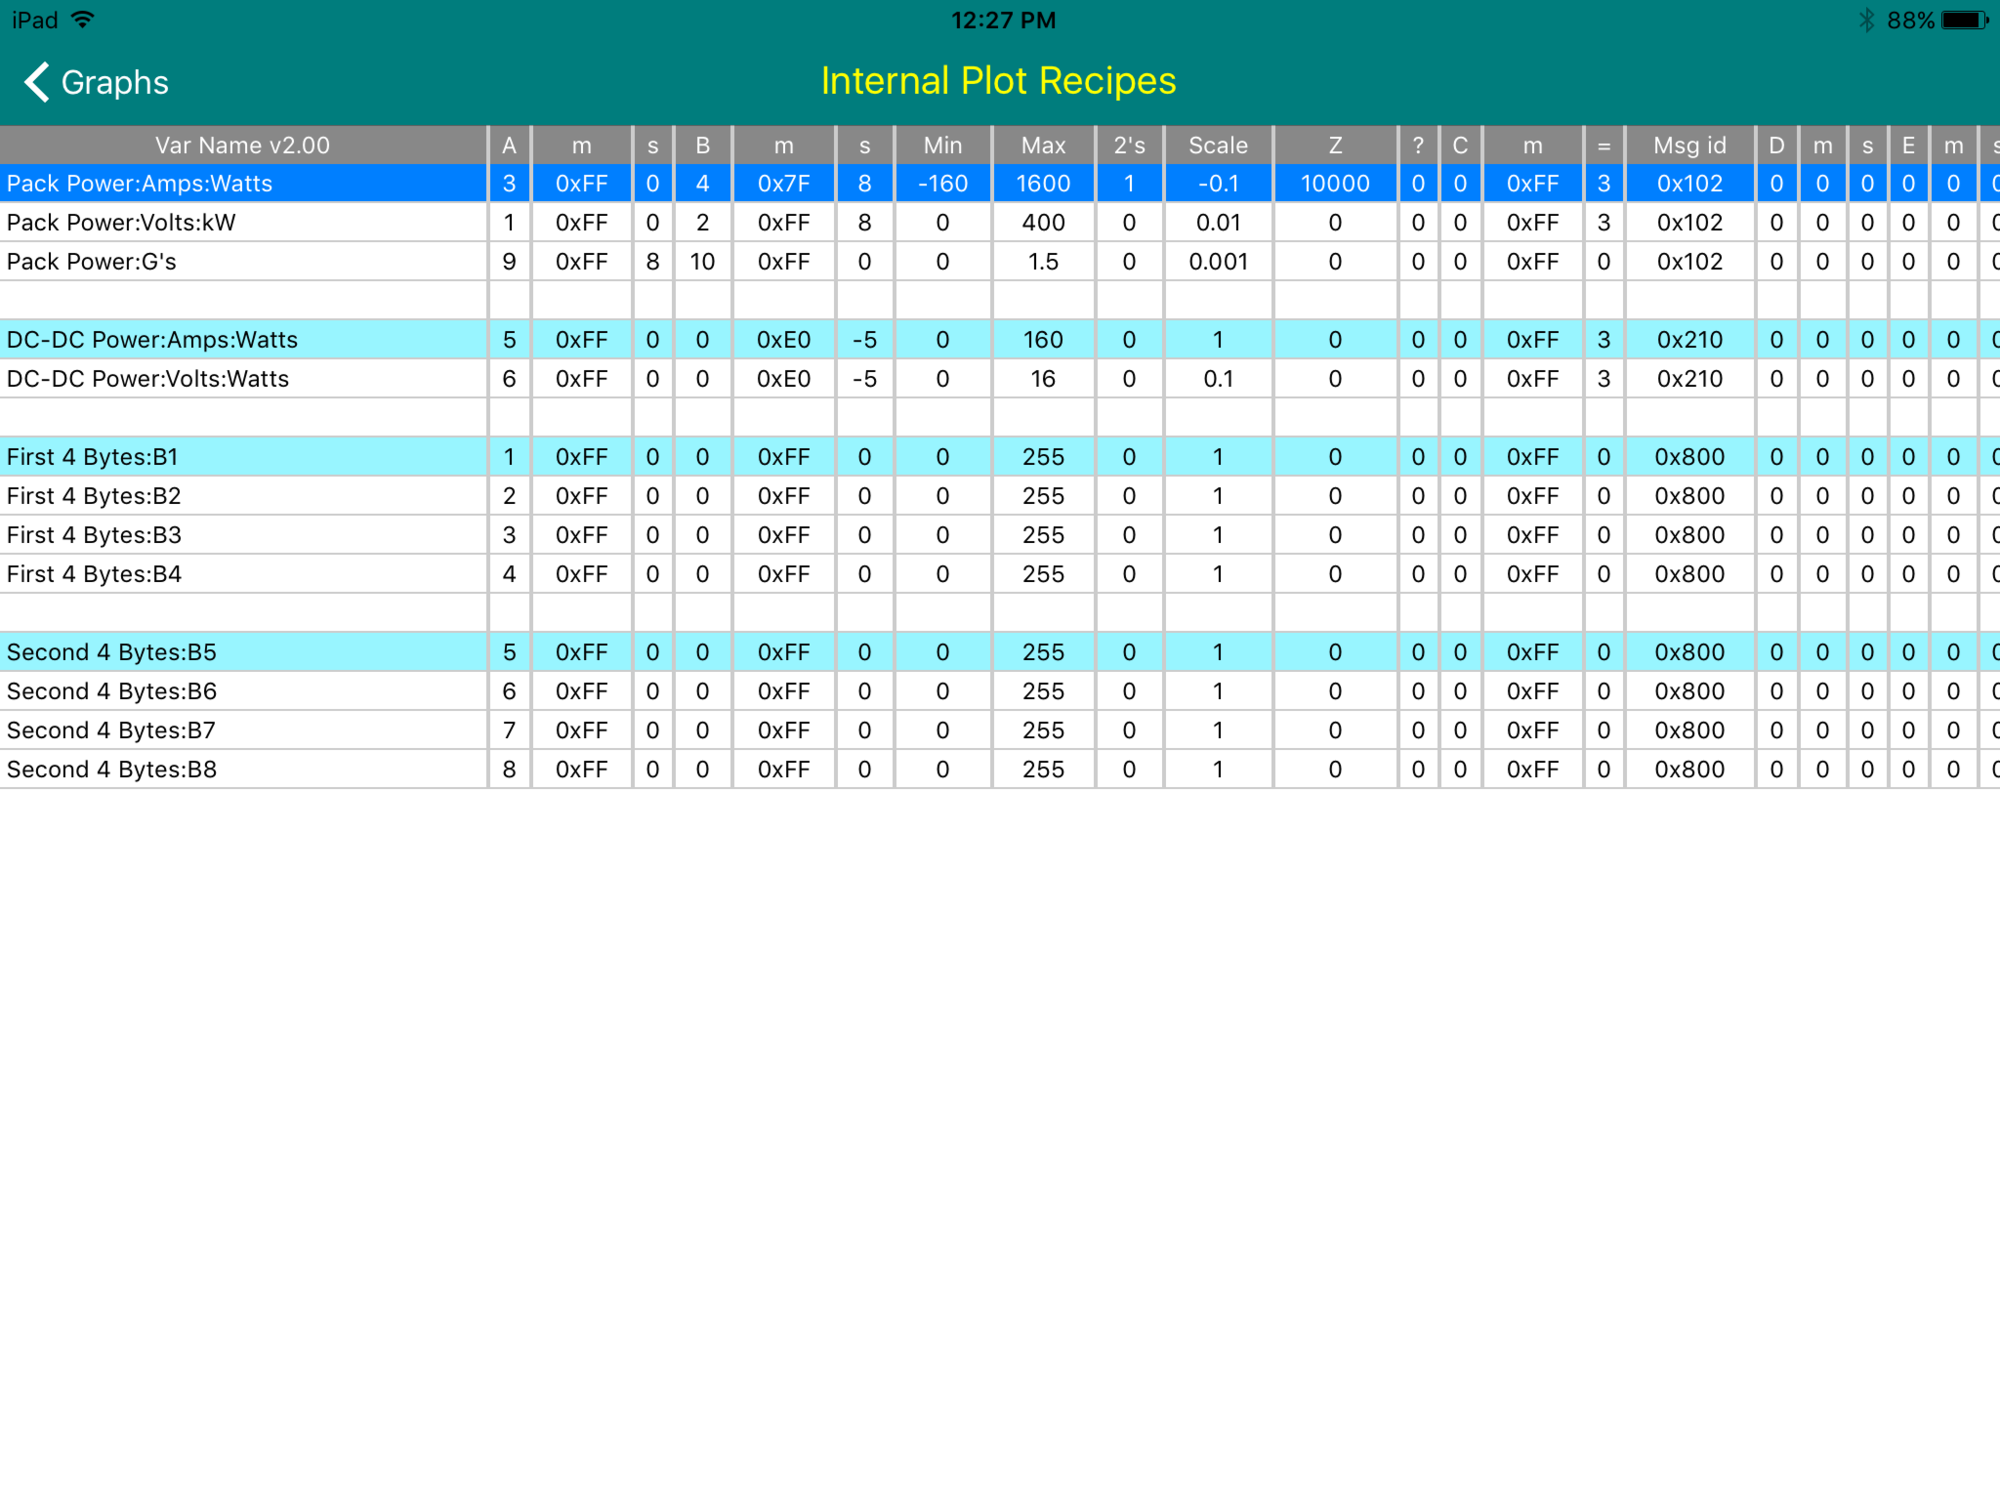
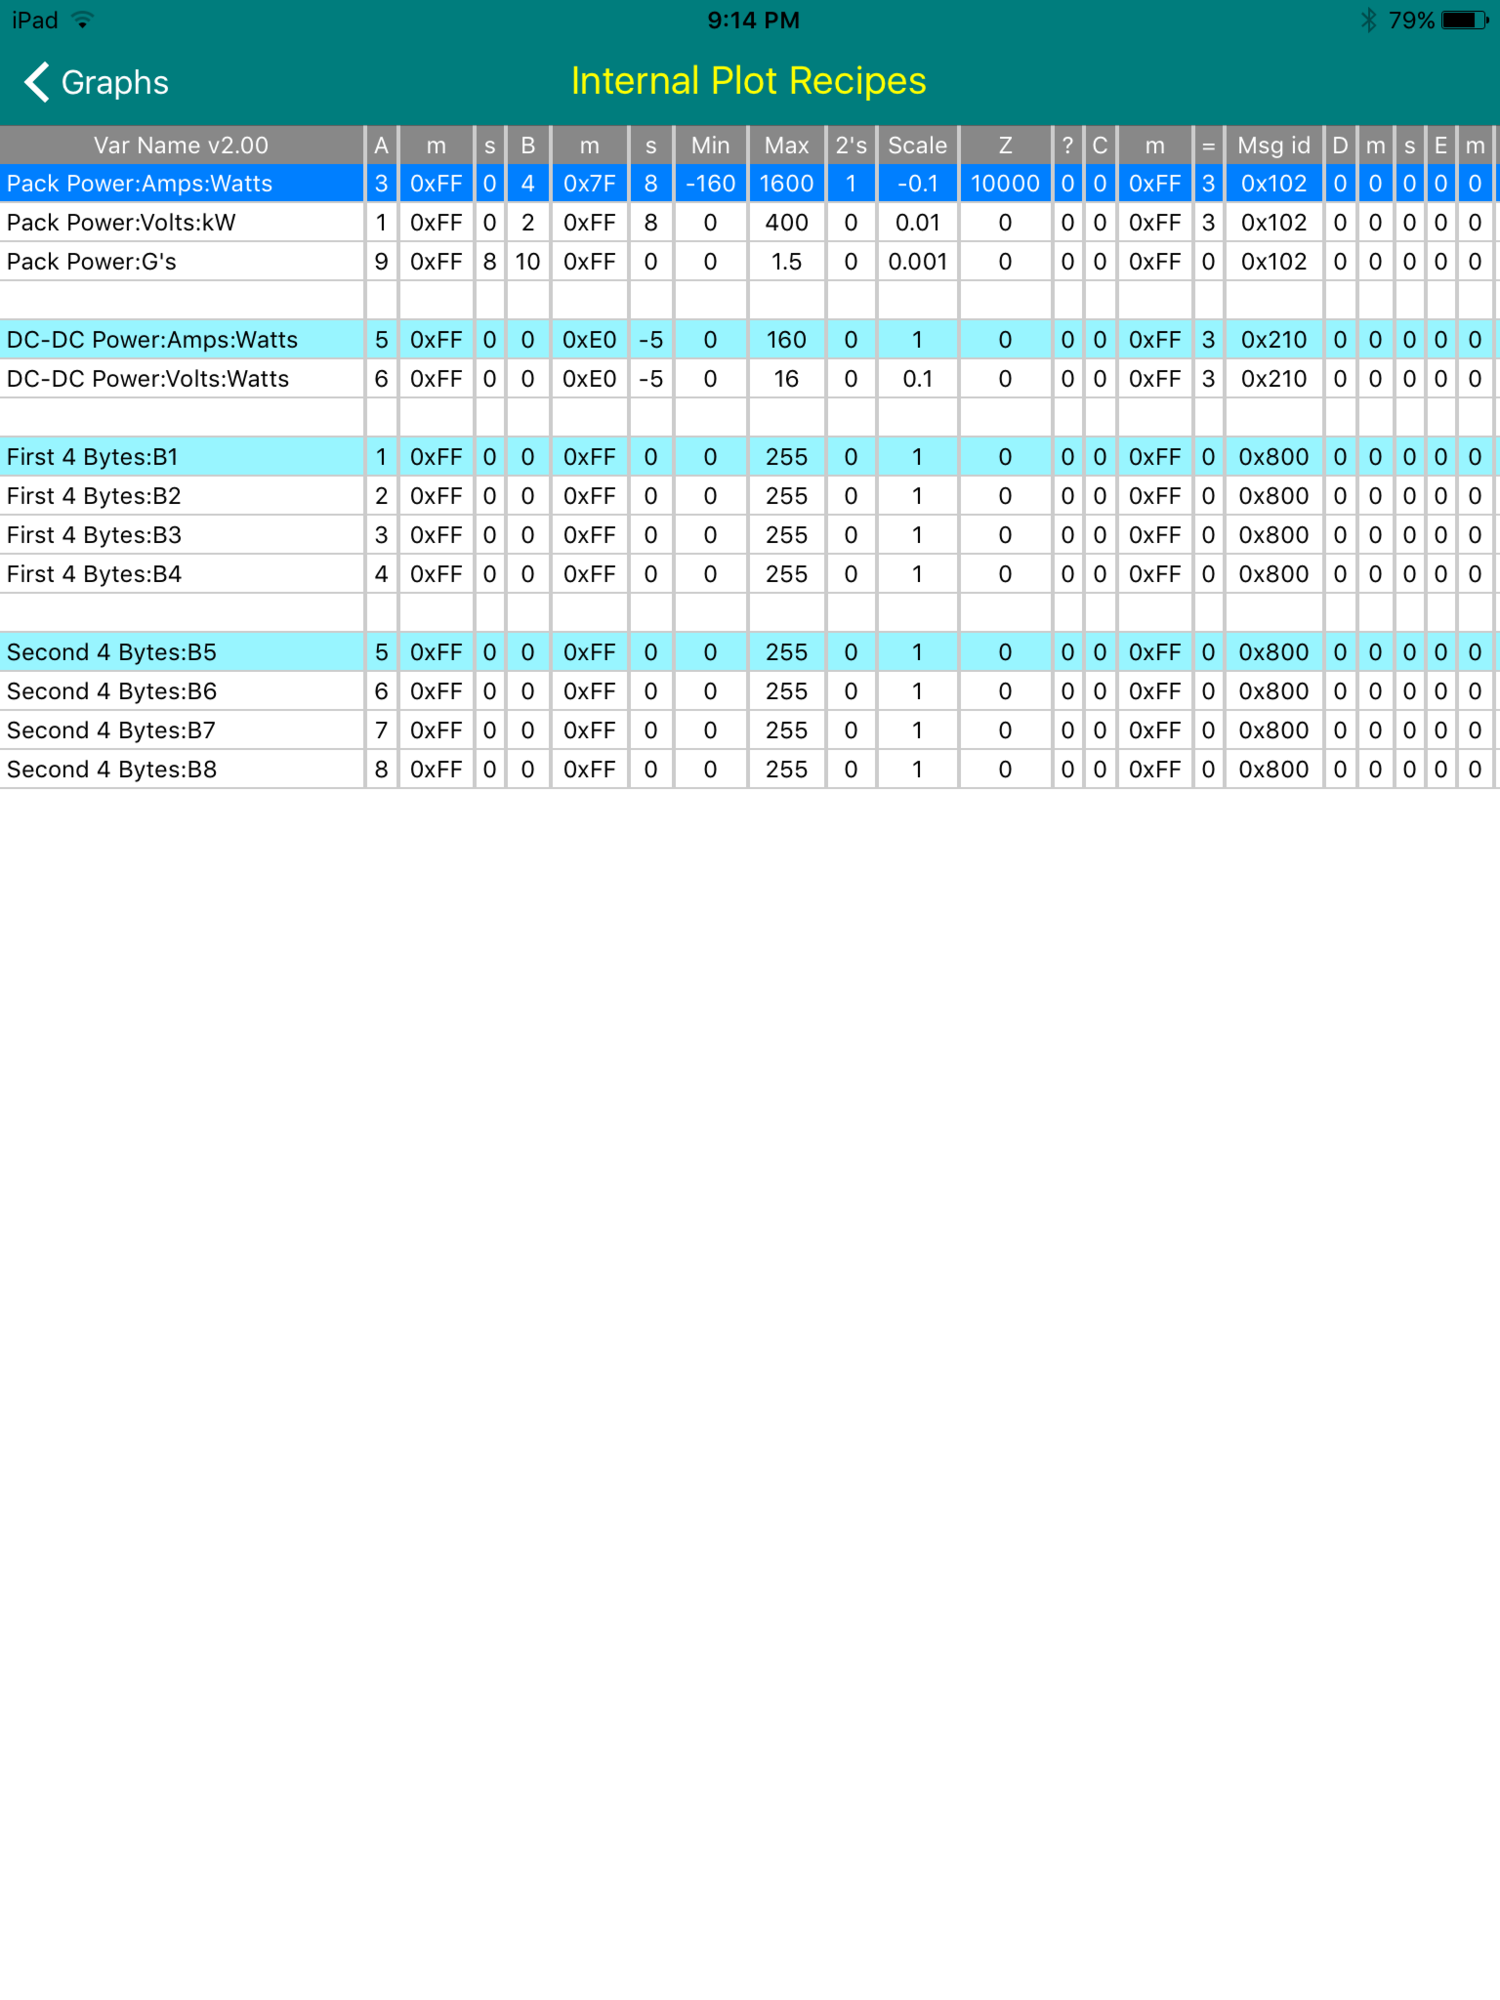
Turbo3 Here is tomorrow's version 0.1.29 improved Recipe viewer. The dark blue highlighted line is initialized to the plot group used by the graph screen and now can not be moved as was possible in 0.1.28. As per Gary's suggestion only the first line of a plot group is highlighted in light blue.
There are two recipe files. One internal and the other user supplied. Which one is shown by the viewer depends on the plot group currently being used to create the graph (or last graph shown if you are not on a graph screen).
This screenshot is of the internal recipe file with the updated short header labels and blank lines added between plot groups.
 �
�
Apr 13, 2016
garygid In v0.1.28 with each blank line in the User Plots file just a blank line,
or using 22 commas for the "blank line", ... either way the app aborts
when trying the new View (User) Recipes function.
What am I missing, please? ..... More testing ... I found that:
1. a PT (or possibly PT
2. Apparently, not having 22 commas for a "blank line" causes v28's View Recipes function
to show the first field of the following line as blank.
Perhaps v29 will work differently?�
Apr 13, 2016
garygid A page title of Plot User Recipes, or Plot Internal Recipes, might be
better than just Plot Recipes for both tables?�
Apr 13, 2016
garygid An updated User Plot file to use with v0.1.28 and probably onward.
Dropbox - Public
The previous link, in post #212 above, probably no longer works.
Please try this one, thanks.�
Apr 13, 2016
Turbo3 The viewer is a csv viewer. To be sure your file is csv compliant open it with Excel and then save it as a csv file.
In fact you should only be using Excel to create and modify the recipe files and saving them as a csv file. That is why there is a header line so you can easily understand the meaning of each column. You should not be using a text editor to create recipes files.
And yes you need a PT: or something similar at the start of the name as defined by your format requirements which is what I am using. The viewer will strip that off to save space while viewing but it must be there.�
Apr 14, 2016
garygid If I could find a reliable csv editor that would:
1. open AND save in cvs format,
2. edit in spreadsheet format,
3. work well with Dropbox,
4. not require a paid subscription,
5. have a free trial version to test all the above,
6. support cut, copy, and paste operations on cells and rows,
7. and run on the iPad ...
I would try to use it. Any suggestions?
I asked before and nobody offered any help.
The closest that I could find was Nocs, which displays in spreadsheet format,
but apparently only edits in text format ... so, I edit in text format where I have
good cut, copy, and paste functions, and then view in the spreadsheet format.
------ Concerning v0.1.28 ------
1. I tried a "GG:" instead of a "PT:" at the beginning of a Recipe, and I thought
TM-Spy aborted when selecting "View Recipes", but apparently it was the fully
blank lines that was the problem, because I just tried v0.1.28 again and it works
with the GG, as seen in the screenshot below. So, sorry for that alarm. If we could
go back and edit past posts, I would fix the errors ... but one cannot.
2. The excessive space in the first column you have already taken care of, I believe.
Overall, looking good. I slid the spreadsheet slightly to the left to be able to read
all the colums on one screen. In your v0.1.29 that should not be necessary on the
landscape iPad.
Thanks Jim, for your continued great work.�
Apr 14, 2016
Benjamin Brooks Got it, will try it out. Thank you!�
Apr 14, 2016
Benjamin Brooks I downloaded Gary's recipes csv file. The app crashes when I click on 'View Recipes'. (I do see them in the 'Options' drop down menu though).�
Apr 14, 2016
garygid Ok, Ben...
I am glad the link works to get the file. Thanks for testing.
Now, here is a link to a copy of my fixed User Plots file that does not have the crash feature.
Dropbox - Public
Cheers, Gary�
Apr 14, 2016
Benjamin Brooks Thanks, all better�
Apr 14, 2016
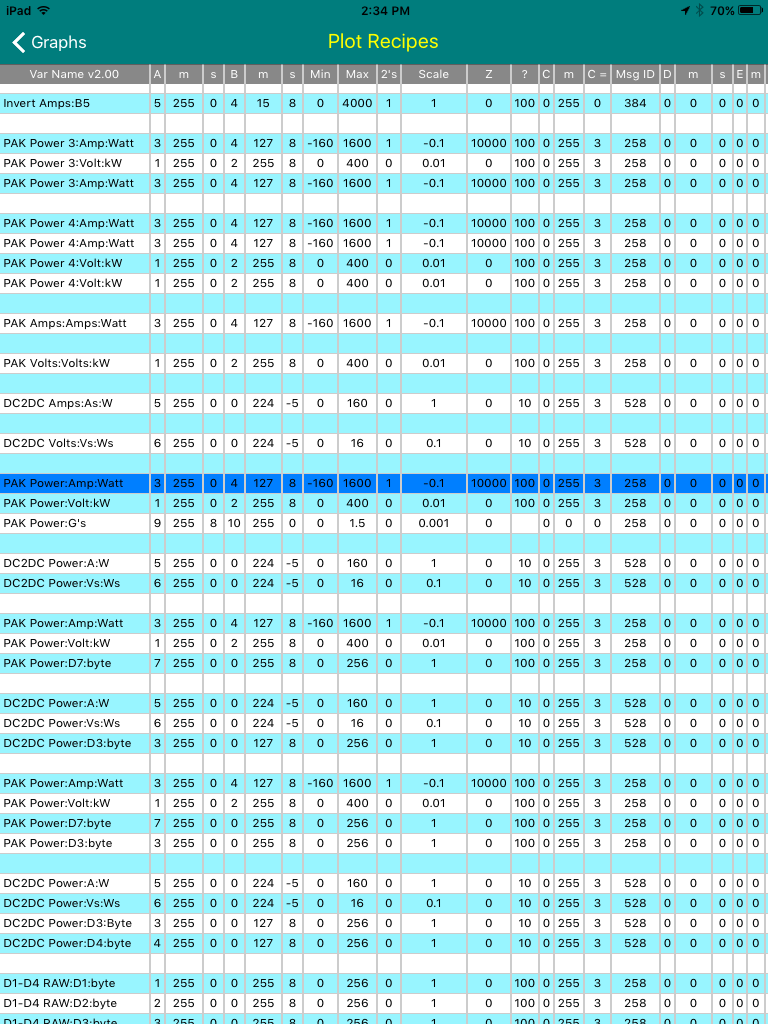
garygid Using the new v0.1.30, the View Recipes spreadsheet is quite nice.
The first column seems wider than necessary, apparently not auto- sizing like the rest of the columns.
Cheers, Gary�
Apr 14, 2016
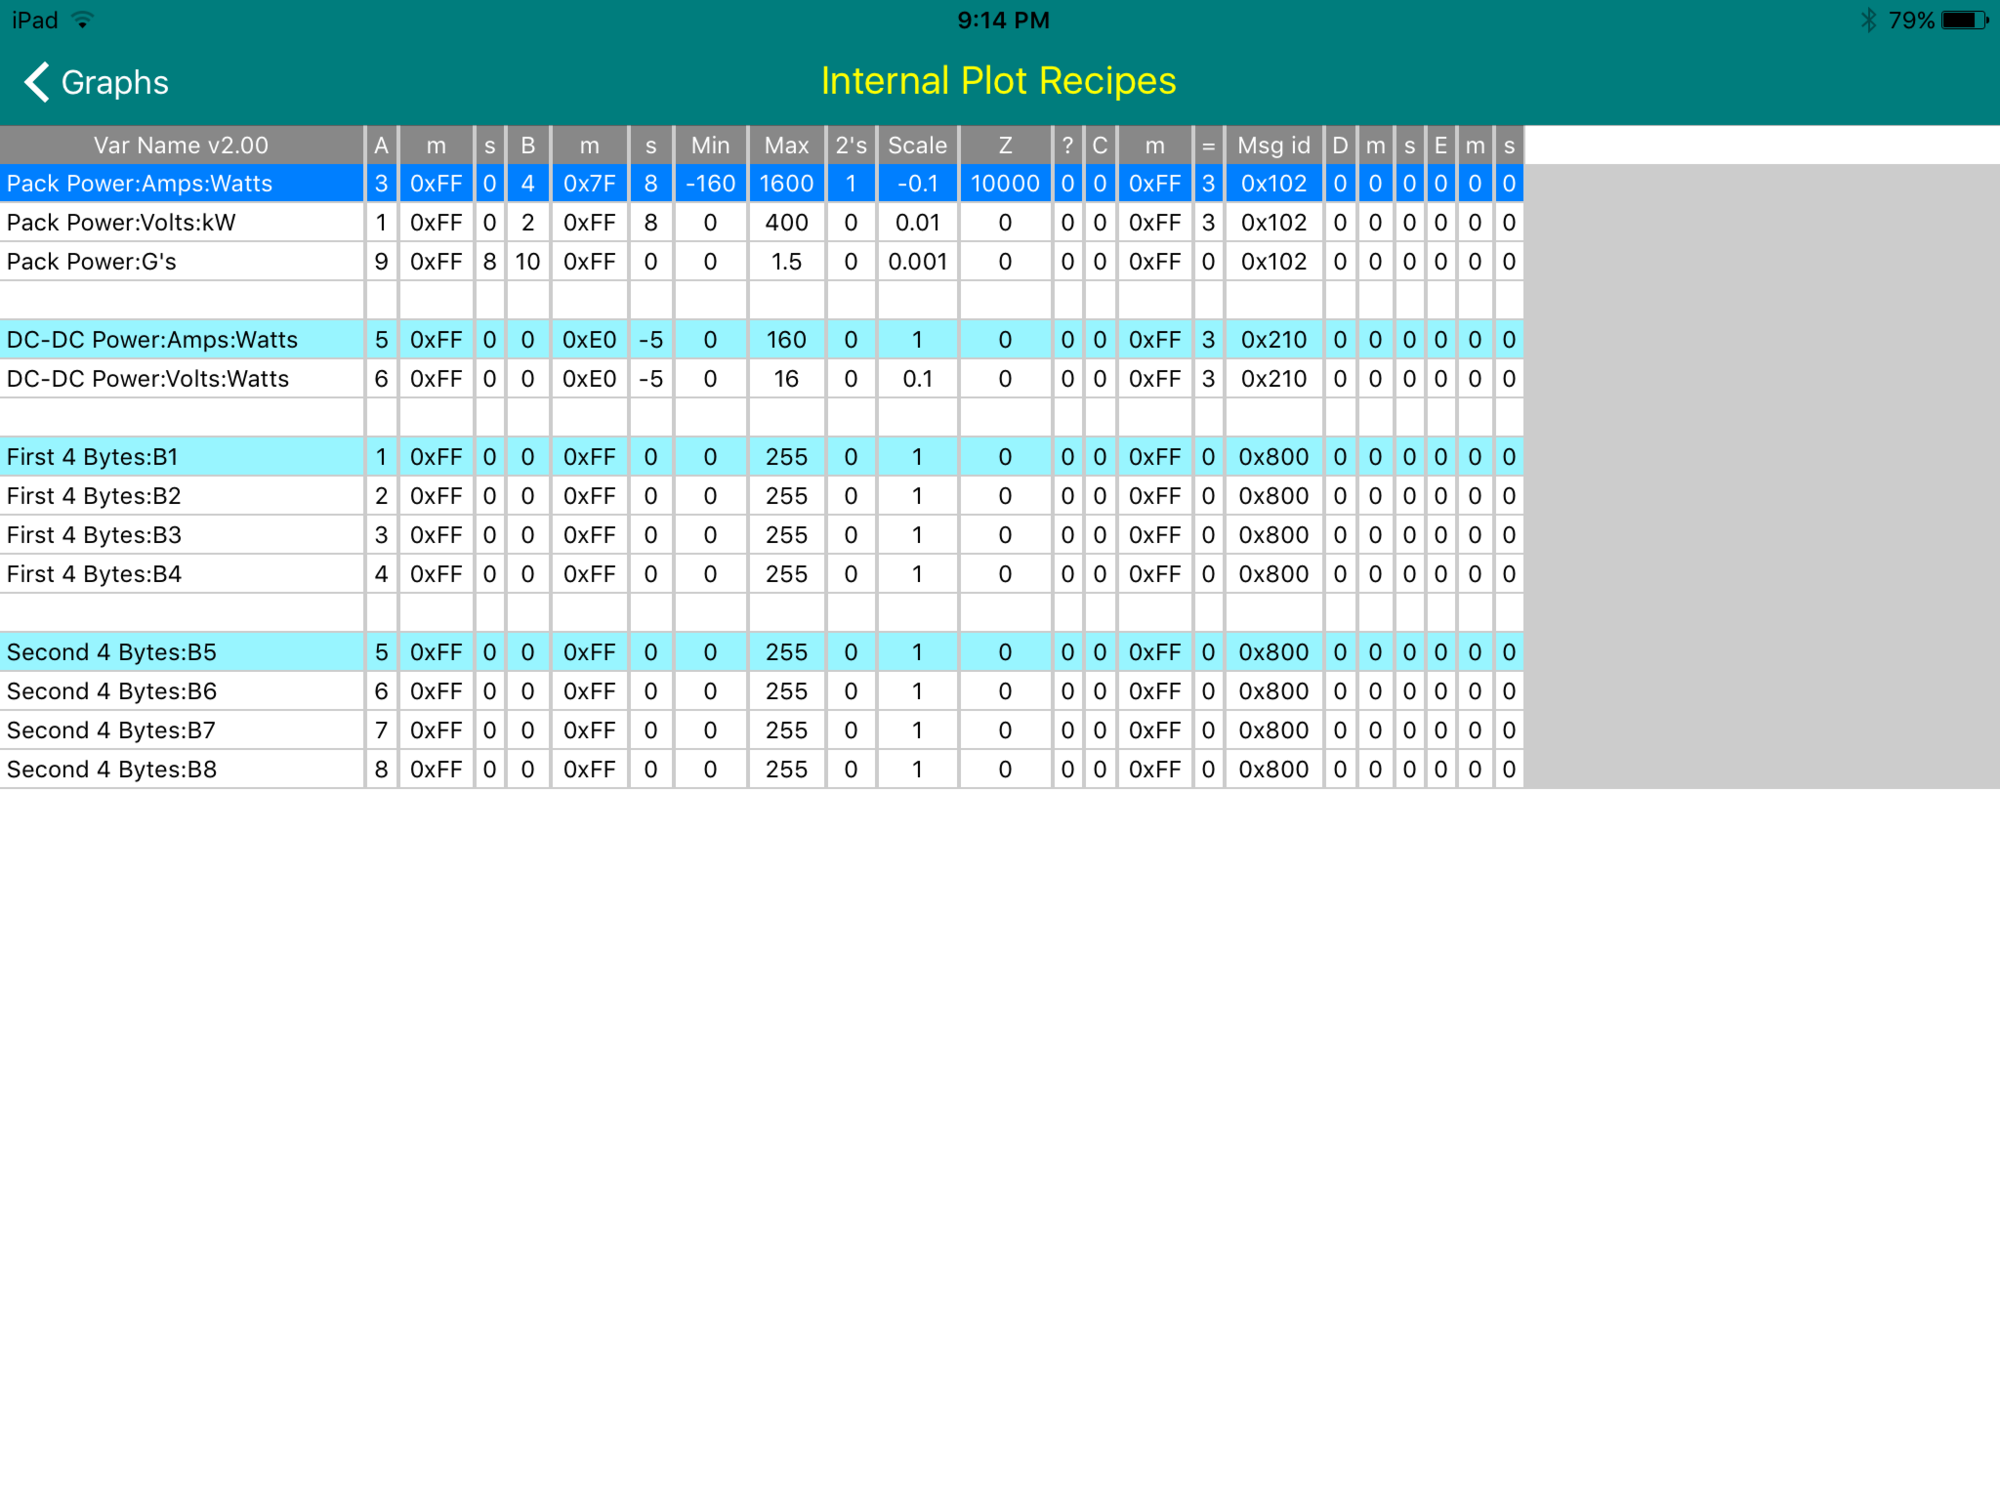
Turbo3 Here is what it looks like on my device. Column 1 looks ok. All columns have auto sizing.
 �
�
Apr 14, 2016
garygid Notice in the top row of recipes in the two screenshots aboce, that the margins around the values in my iPad version are noticably wider than those in your screenshot, like in the Z column, for example.
Is there some "squeeze as much as possible (or expand) to fit to screen" default, and in yours it squeezes a lot to try to fit, but in mine, for some reason, it thinks that it has managed to fit the screen and does not need to squeeze any farther?
Perhaps here is a clue, using View Recipes in portrait mode on the iPad, where the screen is only about 75% as wide, the spreadsheet is squeezed more, to almost but not quite fit, almost the same as the spreadsheet was drawn expanded wider to "fit", when the screen was in landscape mode, as seen in my post above. Here in portrait mode:
Then, if I turn the screen from portrait to landscape AFTER the spreadsheet is constructed in portrait mode, one can see the entire width of the spreadsheet, shown below.
Apparently an "interesting" spreadsheet drawing routine, right?
But, basically it works well enough to be very useful, I think.
Cheers, Gary�
Apr 14, 2016
Turbo3 I found the cause earlier today. There is code to expand if the table will not fill the screen width. It looks like it does not account for the vertical lines only considering the space for the text. Another problem is they used integer numbers instead of float so there is some rounding up. End result is they overshoot the expansion by just a little. That is why you have the problem in both orientations.
Also this calculation is only done once when the Table routine is entered so if you rotate the screen the widths are not recalculated.
I need to work on another project so it will be a while before I release another version. I don't think these are critical problems so can wait.�
Apr 15, 2016
garygid Working in integers is probably appropriate, since they must display in whole pixels, but it does need to be done correctly. Although they use a thin line, presumably only one pixel, to separate rows, they use a thicker line, perhaps 2 or 3 pixels, to separate the columns. They use a thin vertical line on the right side of the spreadsheet, and none on the left side. They use no line, or the title box on the top, and just a thin line at the bottom. Probably just hurried, slightly careless work, but somebody's idea of "good enough". It happens frequently in library functions, even my own at times.
We wish you well in your other projects, and I will try to get some real, all-msgid Logs accumulated, while charging, while Supercharging, while driving, and while parked.
With a new function in CAN-Do, after I read one Log file, I could write a coordinated set of over 300 X-files for others to look at. Then, even those without an adapter or an appropriate OBD dongle, or reluctant to dig into their car to access the Tesla Diagnostic Connector, could have real, parallel msgid data files to look into, investigate, examine, or just "play with", even while totally off-line. I will try to accomplish this "soon".�
Apr 18, 2016
garygid I captured Pack Power data while Supercharging today, one file of about 159,000 frames, and a second file of about 200,000 frames, both at about 95 f/s. Overall, a successful experience. Some comments:
1. After Stop Rec (stopping the data gathering), I Saved, but then there was no option to Clear. I thought that there was one, but maybe I am mistaken, or has Clear just gone missing? Presumably, some would like to have the option to Clear the captured data instead of Saving it.
2. Then, moments later, when I started gathering again ... the magnification was not reset to 1x, but remained at something like 900x, causing the data gathering screen to show the new data way, way over-expanded. If I stopped gathering, ran the zoom down to 1x manually, and started again, the data gathering display appeared OK.
3. Instead of capturing at about 95 f/s, I would have been happy with recording at about 1 or 2 per second, but the Settings option to record at 10 f/s was no longer there. Perhaps it disappeared waiting for the new ROON (Record-One-Of-N) frames feature, which would better allow for very long recordings. Or, perhaps I just did not recall the trick filter values in the Recipe, if that is implemented. Was it set Byte C# to 9 and Equals to N ? Is that working yet, or is a Settings Option intended for the future? I do not see it mentioned in the Change Log.
4. In v0.1.30, what is the maximum number of frames in one recording? There should be somewhere for the user to see that MaxFrames number. What happens when that maximum is reached? Is there the possibility of an automatic Stop, Save, and re-Start Gathering, which would be rather cool feature?
5. When ax X-file is loaded, the frame number at the left margin is shown as 0, but perhaps 1 of 159000 would be more useful, to indicate the number of frames stored in the loaded file?
Cheers, Gary�
Apr 18, 2016
Turbo3 1. Why would you want to clear the graph you just captured? When you start another capture it will auto-clear.
2. Gathering always starts at max magnification. To change you just need to go into Zoom mode (you don't need to stop capturing) and tap the top of the graph to zoom out. This may be changed in the future to default to one minute of data because I find it annoying to always need to zoom out. But at the moment that is the default behavior of the code and to change means adding some special code for that case.
3. Capture 1 of N has been there for a while now. Just set "C#" to 9 and the "Equals" to N. Then only every Nth frame is captured.
4. Max frames is 760,000. Any additional frames are discarded. That equates to 2 hours at 100 frame/second.
5. The left margin number is time not frame number so for a loaded graph 0 is correct. If you want to see how many frames there are go to the bottom of settings and select Debug. The first number on the third line of the graph is the total frames captured.�
Apr 18, 2016
garygid 1. because the second graph did not start the same as the first, and ...
because it was not obvious that it would auto-clear and not append to the previous in-memory data.
2. seemed to start at 1x the first time, but not the second time. I will test again tomorrow.
I will try to get some screenshots.
3. Great, I coded some 1/5, 1/10, 1/50, and 1/100 800-Capture Recipes, which I will try tomorrow.
4. 760,000 frames max, thanks. It would be nice to be able to see that number in the app, perhaps as a note on the Settings screen in Options. Or, perhaps as 0 of 760000 (or 123456 of 760000) on the header of the data capture screen.
5. Settings Debug Enable On. Good thanks.
I will try that while gathering data ... or does supporting the Console screen adversely affect, or possibly kill, the data gathering, even when not looking at the Console screen?
Cheers, and Thanks, Gary�
Apr 19, 2016
Turbo3 The Console is always there. You just can not get to it unless you enable it on Settings. If you go the to Console and enable live viewing of frames that might impact collection of frames but I have not tried it to see if the frame rate drops. You should only tap that feature on then quickly off again to collect a few frames to see what they look like.
There is no "Appending" of frames with a second start capture. When you start capturing it has always reset the pointer to zero. Frames are captured until you stop it. There is no "Pause". That was dropped long ago. Once the end time stamp is written that is it. Nothing else can be written to that data array. You can save the data array or start another capture which overwrites the previous data.
While capturing you see the current sample number in the lower right corner status area.�
Apr 19, 2016
garygid Thanks, I had noticed a comma and a growing number appended to the normal status number ... but maybe it is the number of frames captured modulo 10000?
Also, a comma space number might be more understandable, if there is sufficient room.
You know the app and its complications well. New arrivals (or old, sometimes forgetful guys like me) do not have your store of knowledge. I am trying to see the app through the new arrivals eyes, where some have said that it is difficult to figure out how to use this very-capable app.
For example, somebody is playing with data gathering, called variously capture (a good, short, descriptive term) as in "ready to capture 102" and Rec as in "Stop Rec". To you, Save means Write any captured data to an X-file, or "Write X-file". To new arrivals, the question of save what, to where, overwriting what, if anything, might come to mind. As you get closer to a Release version, a few extra well chosen words for more consistancy and easier learning might be very helpful.
Thoughts on Releasing, just thoughts... hoping for other comments or suggestions:
1. How about Releasing a free Lite version that only shows the Battery Voltages screen and the screen 1 of 4 (the voltage Histogram) so that people can easily see if the app works with their hardware? That would be only one line of code different from the Standard version, I suspect.
2. Then, add the Module Temperatures (2 of 4) and X-file viewing (3 of 4) in the standard version, and perhaps Capture and look, but possibly no Save, and no User Plots ... just a few lines of code from this to the Pro version, ... for perhaps $15, $20, or even $25 or so.
3. The Pro version, with Capture (and Save) and User Plots enabled, would also include an 800-expanded "internal Plots" so that the magic msgID (800) functions would automatically become available, as would the list of msgIDs, ... for an additional $10, $15, or some such, perhaps as an in-app "upgrade" purchase, if you know how to do that.
In any case, I plan to test more captures today. More Later.�
Apr 24, 2016
garygid See a discussion of the capture of "Steering Pot" data (msgID 00E) starting at post #239 in the nearby "Using TM-Spy to see Model S Data" thread.
I will try msgid 106 next ... perhaps rear drive RPM (thus Speed) and Pedal Percentage ...
so, first to gather some data in an X-file, then look at the raw data, look for 2-byte variables, try to determine zero offsets, if any, or signed values, like for the RPM, and possible scale factors.
If you cannot yet capture data with TM-Spy, you may ask for a copy of my X-file, to explore the data for yourself, if interested in such foolishness. (grin)
Cheers, Gary�
Apr 25, 2016
garygid See a discussion of the capture of msgID 106 starting at post #247 in the nearby "Using TM-Spy to see Model S Data" thread.
Cheers, Gary�
Apr 27, 2016
garygid See a discussion of the capture of msgID 102 during a Supercharging session, starting at post #252 in the nearby "Using TM-Spy to see Model S Data" thread.
Cheers, Gary�
May 2, 2016
garygid When using the LELink BT 4.0 LE dongle, if I leave it attached and powered On,
can anyone else just walk by and attach to the LELink dongle in my car?
If so, is the only practical security procedure to unplug the dongle, or install a power On/Off switch for it,
or possibly access 12v switched power somewhere near the cubby?
If one uses a WiFi dongle, at least it can have its Access Point's security password set, right?
If so, how does one set the SSID and password, if possible?
Thanks, Gary�
May 4, 2016
Turbo3 Yes, anyone with TM-Spy can stand next to your Tesla and capture data. Makes not difference Bluetooth 4.x LE or WiFi. Even WiFi with a password as the only one I know of uses 12345678 as the password. I don't know any that allow you to set your own password.
But Bluetooth 4.x LE does not show up when you go to the Bluetooth Settings menu and scan for Bluetooth devices. It only shows up there after you have connected. A normal app would only look for Bluetooth 4.x LE adapters it knows about. You would need to use an app that scans for Bluetooth 4.x LE devices to see the LELink. Then you need to know how to talk to the LELink as each Bluetooth 4.x LE adapter has its own connection parameters.
If you are really worried then power the LELink only will the Tesla is ready to drive. Or you could add a switch on the console somewhere.�
May 4, 2016
apacheguy There are indications that Telsa scrambled some messages in the most recent software. How is TM-Spy doing with motor torque and pedal position?�
May 9, 2016
Roadrunner13 I manage to get my LE Link BT 4.0 delivered here in the Great White North.
So I started playing with the iOS version and this is really fun stuff!!!
I wish I could be spending more time...but after spending a couple of (scattered) hours re-reading the thread and trying to access all of its goodies,
I picked up a couple of important quotes from you, Gary and if you don't mind, I'll link back here for any new-bee trying to figure this out.
To get access to the 'View recipe' menu (discussed higher in this page),
you need some manipulation since when the app is downloaded from the store, the menu is gray out.
You want it to look like this in 'blue' when you select the top-right corner "Tesla E symbol"
To achieve this, you must download Gary's file (spyvarparmlist.csv) from Dropbox's link below (also higher on this page)
and then install it as per:
Using TM-Spy for iOS
This unlocks the 'View Recipes' gray menu.
The recipes shown can be:
1. Either the internal recipes used by the user graph recording option in the application OR
2. The custom recipes from Gary's file if you just chose to record one of these custom graphs�
May 10, 2016
garygid Making smaller X-files:
I have been logging the Pack Volts and Amps (msgID 102) using the "capture just 1 of N" feature of TM-Spy, with N set to 50. Then, a 50 minute file is only 6000 frames, instead of the 300,000 frames which would be captured when recorded at the CAN3 bus's full 100 f/s rate for the 102 msgID. To set the 1 of 50 in a Recipe, the C-byte is set to 9 and Equals is set to 50 (the desired N).
Today's Supercharger test with an S85 shows some unexpected oscillations in the charging power, in the amps or the kWatts. Does anyone actually know why these oscillations are there?
Possibly reducing power while the Pack is being cooled ... see the snapshot of module temperatures below.
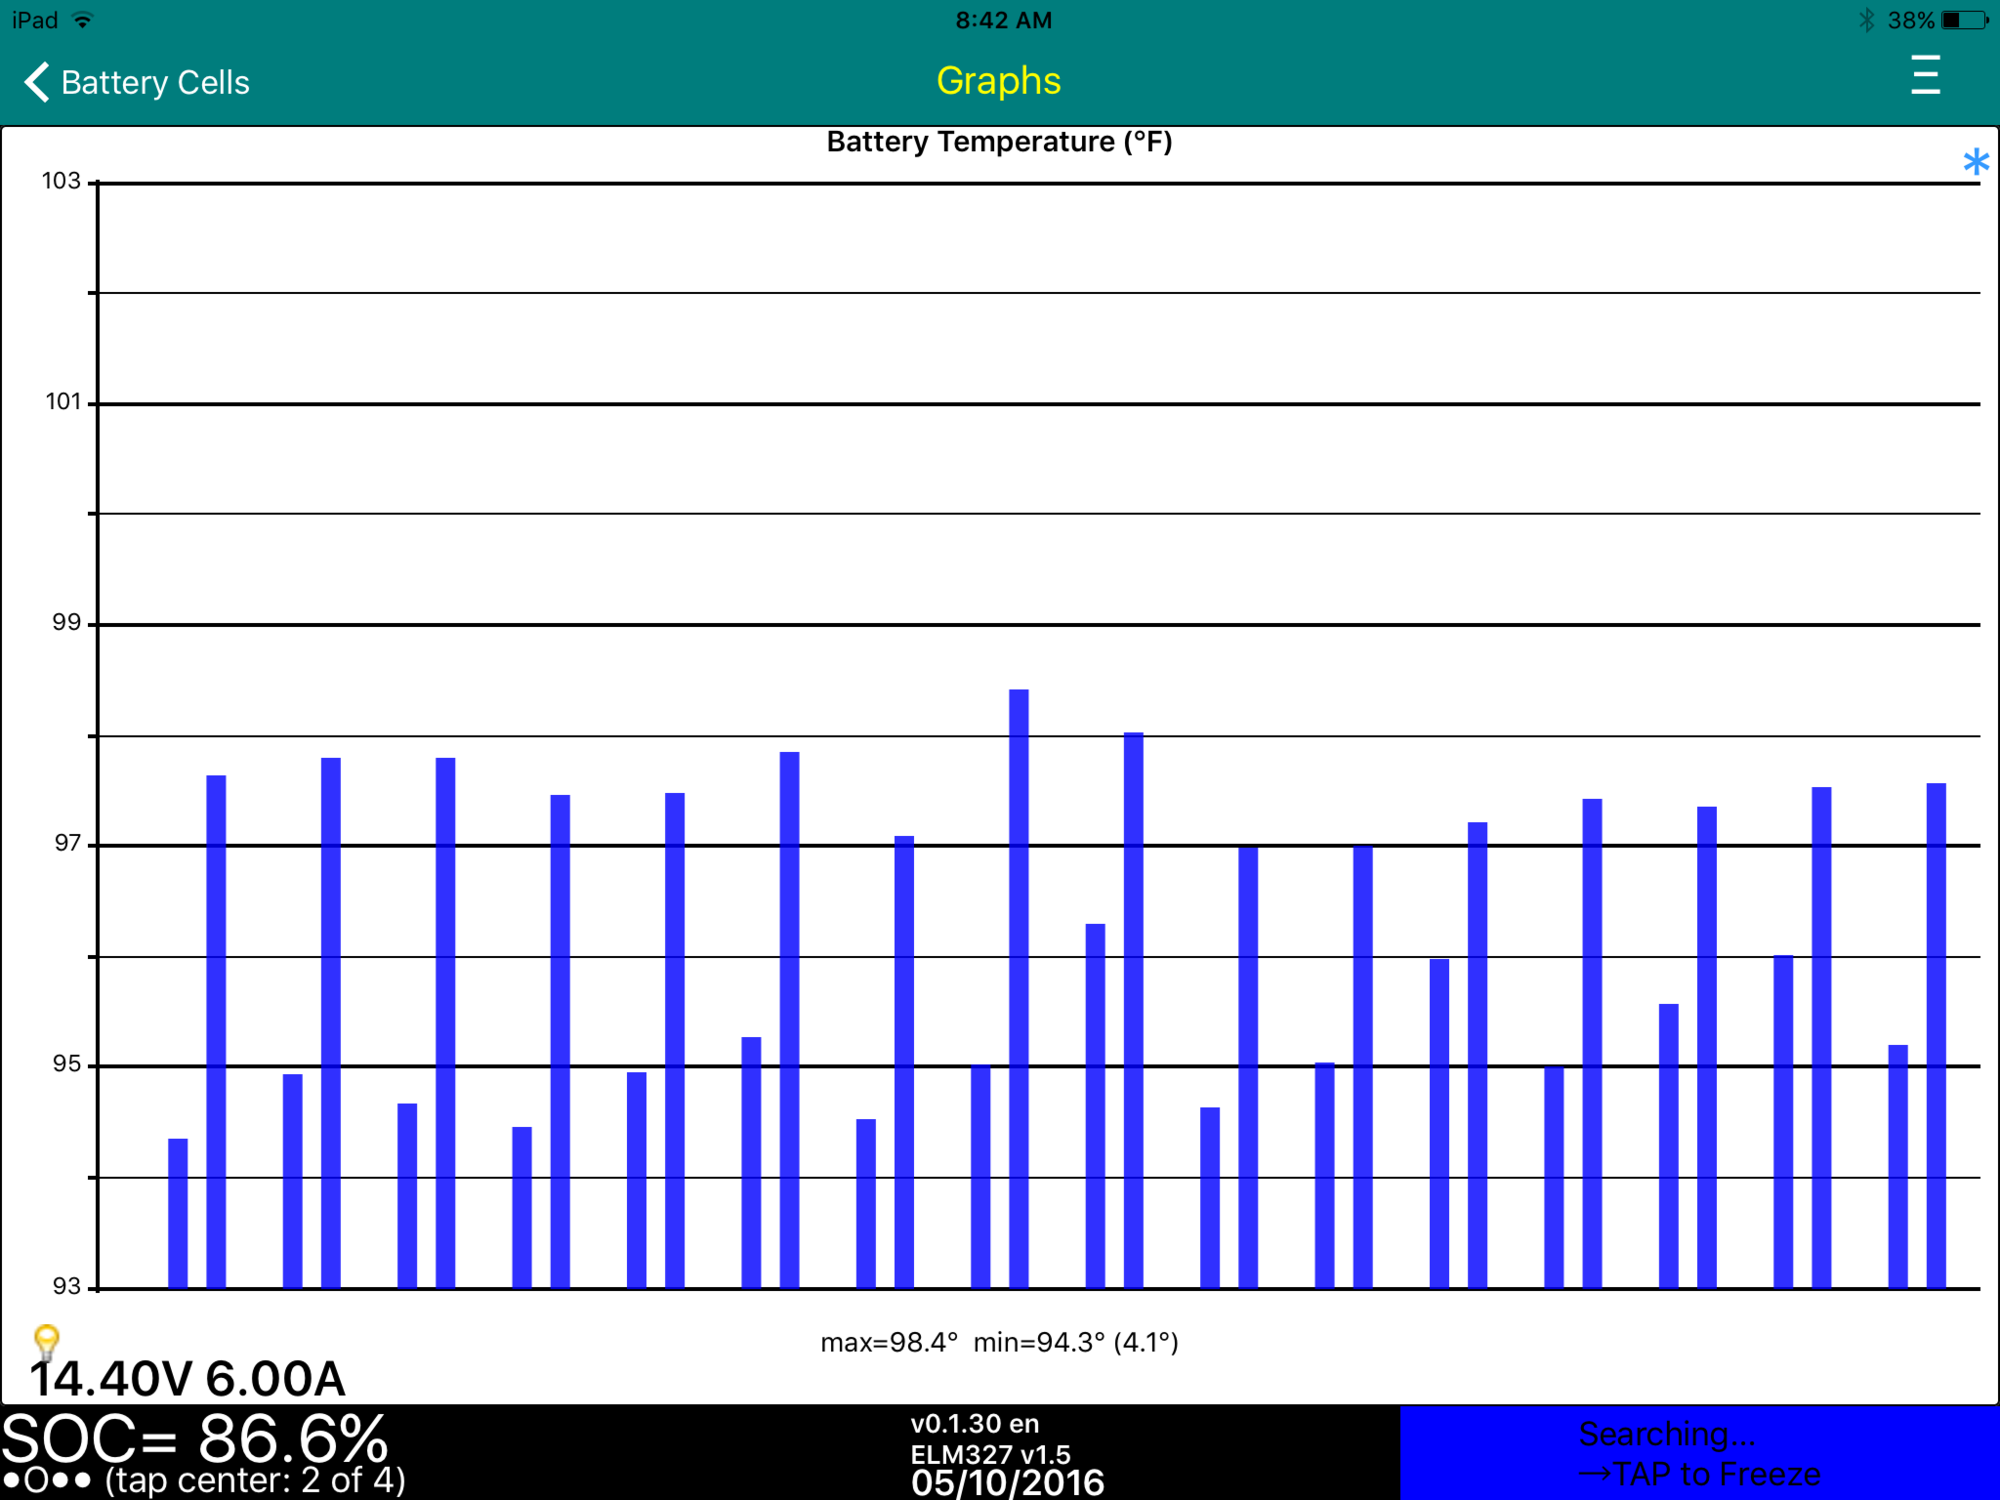
The ambient temperature was only 65F this morning.
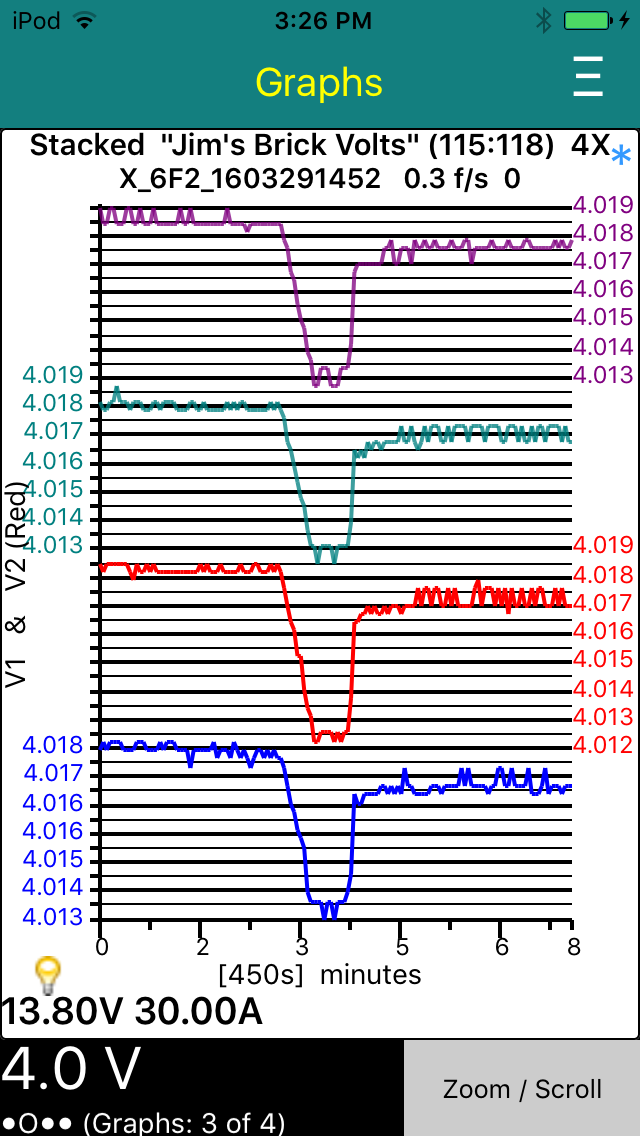
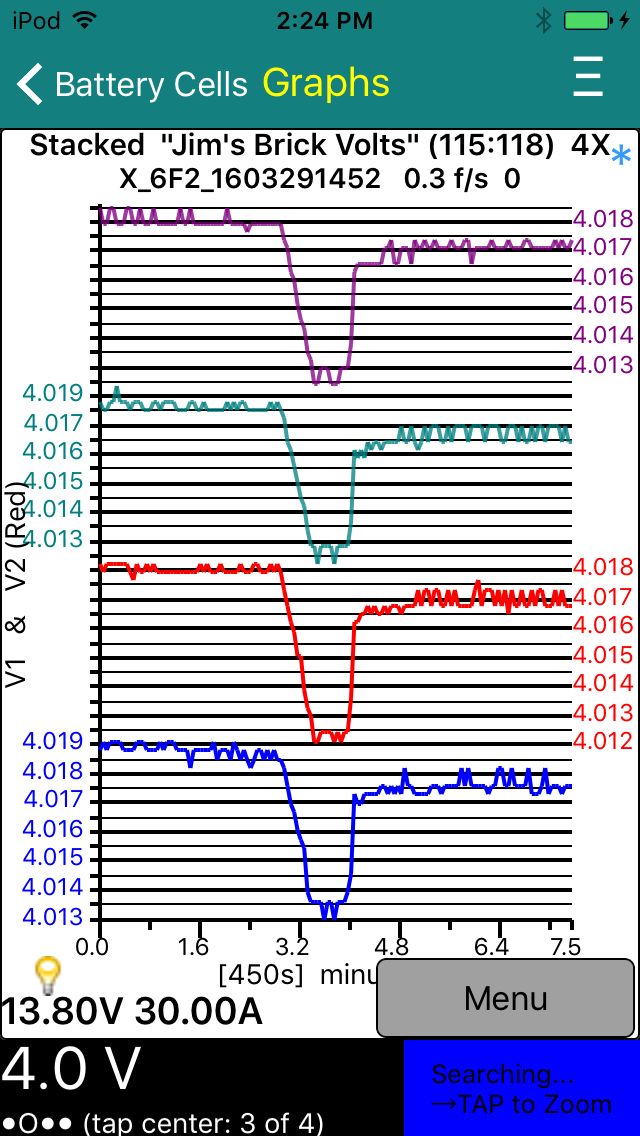
Here are the normal cell-brick voltages, and the same voltages while charging (click the thumbnail to see the full screenshot):
and

Quite a noticable voltage difference for the 6 bricks in each module, while charging, it appears. But, note that the voltage varies with basically the same patern in each group of 6 voltages (presumably within each module). This might indicate that the variation has something to do with the design or construction of the module. Possibly the apparent cell-brick voltage variations are just due to the brick voltages being not measured accurately when high currents are flowing through the module?
What are others seeing?
Cheers, Gary�
Không có nhận xét nào:
Đăng nhận xét