Dec 2, 2015
maoing It's good to create buy opportunity after "W" bottom confirmed from TA in 200-210 area.
�
Dec 3, 2015
ev-enthusiast Do you think about buying shares or are you confident enough for calls?�
Dec 3, 2015
ev-enthusiast Anybody paying attention to the technical indicator TTM_Squeeze (link)?
�
Dec 3, 2015
maoing I'm calling to buy dip is purely from TA perspective. But Q4 delivery and model X is still uncertainty in next month or so. So I'll only buy shares, in case of big fall due to miss Q4 delivery or model X further delay, I might buy DITM calls.
�
Dec 4, 2015
austinEV I don't like this getting away from the 200day. Now it looks like a triple top.�
Dec 4, 2015
ev-enthusiast Same here.�
Dec 7, 2015
jesselivenomore We've gotten the pullback on cue, maybe we get to 220, maybe this is it, but that's not important. What's important now is a break of the prior high, 238.6, on big volume. I would say at least 5-6 mil shares. If that occurs then the down trend is broken and a new uptrend back up to all time highs will be established. And that would be significant because I doubt the 280 highs hold for the 3rd time up, I think we break it. But first things first, I believe we will need a news catalyst to break 238.6 on the volume that is necessary. If we break it on low volume it is likely to fail. The news may be first deliveries of the X, but the market may shrug that off especially if the numbers are low. My guess is that we consolidate here until Q4 delivery numbers are released. That should provide the catalyst and volume to break higher.�
Dec 10, 2015
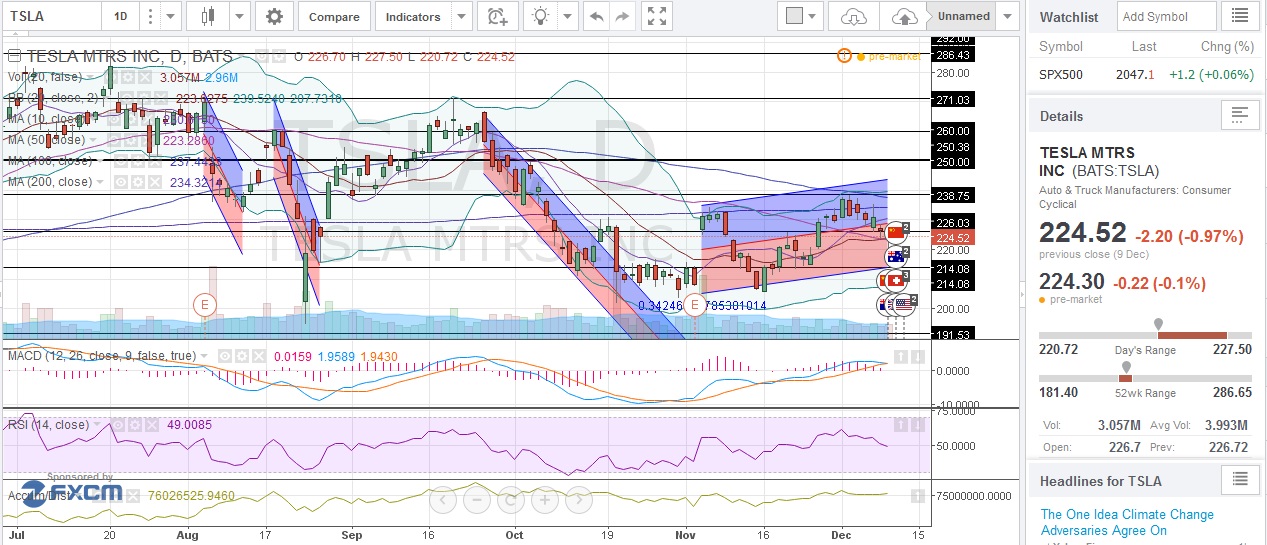
ev-enthusiast Not the most beautiful chart, but here we go:
 �
�
Dec 10, 2015
ZenMan
Any short term interpretation?�
Dec 10, 2015
ev-enthusiast Honestly, seems to be difficult times right now.
There could be some kind of double bottom formed some days ago.
There could be an ascending channel in the works right now.
I think as soon as we are back above the 200DMA and that $236 area again, things should look a bit more positive.
TSLA is currently trading on very low volume.
Any news (pos and neg) could induce wild swings, high short interest helping even more.�
Dec 10, 2015
jesselivenomore It has played out exactly as expected so far. Although I keep saying in the short term thread that most of these moves are noise, and thats true from the big picture, however, its current trading is very clear cut and predictable.
Pulled back from 200 EMA and top of the bollinger bands as expected. The EMA works better for TSLA than the SMA. Look back throughout its history, when it is trading below the 200 EMA, it needs to break it with force and above average volume to confirm a new uptrend. All the times it lacks those 2 elements, share price fails immediately in 1-2 days. Also, throughout TSLA's trading history, whenever it is in a downtrend, the bollinger bands always act as resistance. Only when it pushes into the bands and stays there for a few days, again on high volume, is a new uptrend established. So at 240 both those resistances came into play, which made this pullback very predictable as noted by my prior post.
Now with this pullback there are 2 options going forward. If you are feeling adventurous, you could buy a dip here. We've hit 220 support, also as stated before as a target. Doing so will give you a better average, if you are very bullish and wanted to buy anyways.
Or, the safer play, which is very simply to wait until we break back above 240 with force and big volume. That means a 5%+ up day on at the very least 5 mil shares traded. If this occurs, a new uptrend is established and you can look for 280 as an initial target, but I doubt we stop there this time up.
Personally, my approach is option c, since I've been holding a long position pre q3 earnings, I exited half at the 240 resistance. Once we trade back above that level, I will put the half back on. So if we fail and head lower, I only take half the losses, and if we head higher I don't lose any gains. I am holding half in case there is a positive news event so I still have some exposure if we have a big gap up(likely what is needed to break 240 anyways).�
Dec 10, 2015
AlMc Excellent analysis. Thanks. I am holding a significant cash position as well. The macro that I would add to your analysis would be the Fed interest rate hike. It should be priced into the market but I am betting it causes a flash drop and may provide an excellent entry point as well.�
Dec 10, 2015
jesselivenomore There are two views of current macro environment and Fed hike:
1. The economy is still very weak under the surface while equity and real estate prices are propped up by QE and low interest rates. This is evidenced by weak manufacturing data and historically low labor force participation rates. Thus, a rate hike would be very damaging, taking the patient off the drug when that was the only thing keeping him alive. Markets would reacted negatively to a rate hike in this case.
2. The economy is improving and can be self sufficient even with higher rates. If this is true, then we must normalize interest rates at some point because a prolonged era of low interest rates creates imbalances in the economy that will have adverse long term effects. Thus, an increase in rates will signal "lift off", or normalization to a healthy economy. Markets would react positively to a rate hike in this case.
How the market reacts in the short term is up to which of these scenarios the market believes in. So while a flash drop is certainly a possibility, don't discount a flash pop either.�
Dec 10, 2015
FluxCap Succinctly put. However, some old-school traders I follow have been chattering and posited that there is a third possibility, and one that could potentially cause the most "pain" to options traders: the market does absolutely nothing in response. We shall see what we shall see.�
Dec 10, 2015
AlMc So, as with all things 'investing'; we could have a 'flash pop', 'flash drop', or 'flash flat' . Man, I love trying to read the tea leaves") �
�
Dec 10, 2015
austinEV You left something out. It can be a slow rise or slow fall. Or, a flash pop, followed by a slow drop, aka the "unicorn".�
Dec 10, 2015
Wenche Thanks for the contributions from all of you! Bye my GTC orders I will hopefully catch both the flash drop with my buy orders for Jan 18 calls, and the flash pop with sales orders for my Jan 17 calls�
Dec 15, 2015
ev-enthusiast I took a look back in the time machine and found that pretty short squeeze during 2013.
Does anybody use bollinger bands and keltner channels to determine a squeeze?
What might be possible good parameters for the indicators given the current context for TSLA?
Is there anybody with experience using this indicator?�
Dec 15, 2015
ev-enthusiast Average daily trading volume keeps on dropping, this will make it even more difficult for the shorts to cover.�
Dec 16, 2015
jesselivenomore Today's price action fulfilled my 2 criteria for a trend change to the next leg up, highlighted in the posts above.
A break back above the 200 EMA while 1. trading 5+ mil shares in volume 2. 5%+ in price appreciation
Today's volume of 5.08 mil checks box 1 and indeed is the highest volume traded in 2 months if you take out two outside news events.(10/20 CR reliability report, 11/4 earnings)
Today's price move of 6+% was also the biggest none news event move we've had in quite some time, closing on the very highs.
To reiterate, throughout TSLA's trading history, whenever it is in a down trend and trading below its 200 EMA, a day fulfilling those two criteria while breaking back above the 200EMA has signaled a trend reversal every single time. Now, that doesn't mean it will happen this time 100%. In fact, tomorrow is a crucial day to see if price can hold up, or follow through to the upside. If it significantly falters, a failure is still possible. Like technicals in all cases, just because something has worked in the past does not guarantee future success. It only increases your odds.
As mentioned in posts above, if you bought the first target of 220, you are in great shape, however that was an aggressive strategy. Personally, I adopted the safer approach of waiting for confirmation before re-entering the 50% I exited the first time up to 230s. That confirmation was today.
Once again, how we hold up the next 1-3 days is critical. But, so far so good.�
Dec 16, 2015
dakh Sorry to pick on a single sentence but as the all mighty jhm pointed out, ITC affects batteries so one would expect an uptick on the news. It didn't happen right away though as it was with SCTY so maybe the market decided this is not material.�
Dec 16, 2015
ggr "The market" is mostly ignorant about such an effect, until someone mentions it to them. For TSLA purposes, I think ITC extension counts as no news for the vast majority of people.�
Dec 16, 2015
jesselivenomore Right, the ITC was news somewhat relating to TSLA, albeit not a major news event like the CR downgrade or earnings. My point being, today's volume was good.
Edit: to clarify, the CR downgrade most likely is a complete non-event long, medium or short term, just that the market treated it as one in its initial reaction indicated by the large volume and price movement. The ITC extension may very well turn out to be material news for Tesla Energy's medium and long term demand prospects. However the market, at least initially, did not treat it as such. TSLA opened up 1 point, and was negative at one point before rallying, even though the ITC extension was known since last night. In comparison, SCTY gapped up 16%, obviously treating it as a major material event.�
Dec 16, 2015
Electrifying TSLA is storming its 200 day average for the third time from below and I expect it to break through. Daily chart looks like either a inverted Head and Shoulders or a W bottom. Either pattern predicts a target $270'ish in a few weeks. I am terrible at short term so please take this with a grain of salt.�
Dec 17, 2015
austinEV So much for breaking through the 200day. Of course, we are tracking the market. OTOH, SCTY is continuing its run so we could have continued in a "cousin" rally.�
Dec 17, 2015
jesselivenomore TSLA is holding up extraordinarily well. It is doing exactly what it's supposed to, it was up 6% yesterday, some back and fill is expected. As long as it holds up and doesn't fall apart the next 1-3 days, everything is still intact.�
Dec 17, 2015
austinEV Quite possible. I hope you are right. Continuing 2-3% today would have made you more right
Edit: hey, I snarked and now TSLA is green. Hopefully I eat my words.�
Dec 17, 2015
jesselivenomore Right or wrong is not important. If we hold up the next couple of days, stay in, maybe buy more. If we fail, get out. Trading, especially technical trading, is more about how much do you make when you are right and how much do you lose when you are wrong.�
Dec 17, 2015
FluxCap I like this technical breakout�
Dec 20, 2015
jesselivenomore So strictly technically speaking, the action the last two days hasn't been exactly what you want to see after a potential breakout: we are faltering right on resistance once again. However, put into context of what the market is doing, TSLA is holding up extremely well. The 200EMA is at 232.5, bollinger bands at 239.5, ichimoku cloud at 236.8, and the prior pivot high at 238.6. So four separate resistances within a tight 7 point range right above current share price. It is going to take a lot to break through. I am hoping the ITC extension and model X signature deliveries puts a floor on TSLA around 220 even if the general market continues to come off. As long as we hold in there until Jan 2, hopefully deliveries announcement will be enough to let it truly break out. I believe it is going to take a news event like that and close above 240 on another 5%+ up day/5M volume day to make it happen, so far we are still not out the woods.�
Dec 21, 2015
austinEV I hope/predict we see 3-4% halo effect from the spaceX success. That might, oddly, be the breakout we needed.�
Dec 22, 2015
jesselivenomore We tried at the open but still no cigar. Oddly enough I am getting more and more encouraged by the price action, even on a day where there should have been some halo effect yet we closed on the lows while the market did its part and closed on highs. I am not that concerned because volume was extremely light today(holiday trading), and we were simply still not ready yet to break out. The last thing you want is for the stock to break out of this range on super light volume and no material news, that is doomed to fail and reverse. Some bad news out of Nevada solar vote may have contributed to a sympathy trade with SCTY as well.
The reason I am getting more encouraged is this: We are hitting resistance, that is clear, it is like a brick wall right now. However, the more we hang around resistance without failing, the more likely resistance will be broken. Typically, for resistance to hold, price should bounce right off of it like bouncing a ball. Yet what we are doing right now is we keep on knocking on that door at ever higher frequency, eventually that door is coming down. For example, just the 200SMA we have touched 4 times in the past 2 months, and over the past week price has hit it for 5 consecutive days. So again, one way to look at it is: resistance is super strong. But the other is: resistance can only take so much before the dam begins to break.
In the end, while thats the technical side of it, I still suspect that it will take delivery numbers to bust this thing open. So another week.�
Dec 30, 2015
uselesslogin So here we are again at the 200-day SMA. Hopefully signs of Model X ramp will break us through finally. This is the fourth time approaching/exceeding it in 3 months.
 �
�
Dec 30, 2015
bh1783 
resistance at 240. If it can break this then good chance of a breakout.�
Dec 30, 2015
Johan Wow 240 seems indeed like a line in the sand. But lowish volume so not sure if very significant?�
Dec 30, 2015
bh1783 Volume is not that high today, only 1.25M so far(but much higher than the past few days). Already past the 200DMA (236).�
Dec 30, 2015
Electrifying Hmm looks like today is going to confirm the inverted Head and Shoulders right shoulder breakout above. Target would be neck line (238) plus the neck to head height ($30) so target is $268 within few weeks.�
Dec 30, 2015
bh1783 
sounds about right. Not much resistance until 265�
Jan 6, 2016
maoing The reason I was selling before Q4 delivery report and buying on Monday and heavily today. TA + FA + TMC sentiments
 �
�
Jan 7, 2016
Causalien Didn't you say you spent 50% of your cash buying TSLA before Q4 delivery report Maoing?�
Jan 7, 2016
maoing Causalien, originally I accumulated 50% position towards Q4 and expect a delivery # beat. But later on I read an article on seekingalpha (Yes, I recommend any serious TSLA investors should selectively read articles on SA, a lot of gems there regardless LONG or SHORT biased), plus my own analysis on model X delivery thread. I concluded there will only slightly over 17K model S and less than 200 model X delivered in Q4. My estimation is very close to the real number but slightly pessimistic. But the stupid analyst Trip and much cheerleading noise in TMC alerted me Jan. 4th is more likely a typical sell-on-news event than a rally. Market will be disappointed with lower than hyped delivery # 18300 and much lower model X delivery #. So I sold 25% on hype. Even I was a little bit nervous about what if missing the rally, but I think I already said in 2016 short term thread "even I miss the rally, the SP will return to 220-240 again".
�
Jan 7, 2016
Causalien I see, I do not recall seeing you post that you sold 25%.�
Jan 14, 2016
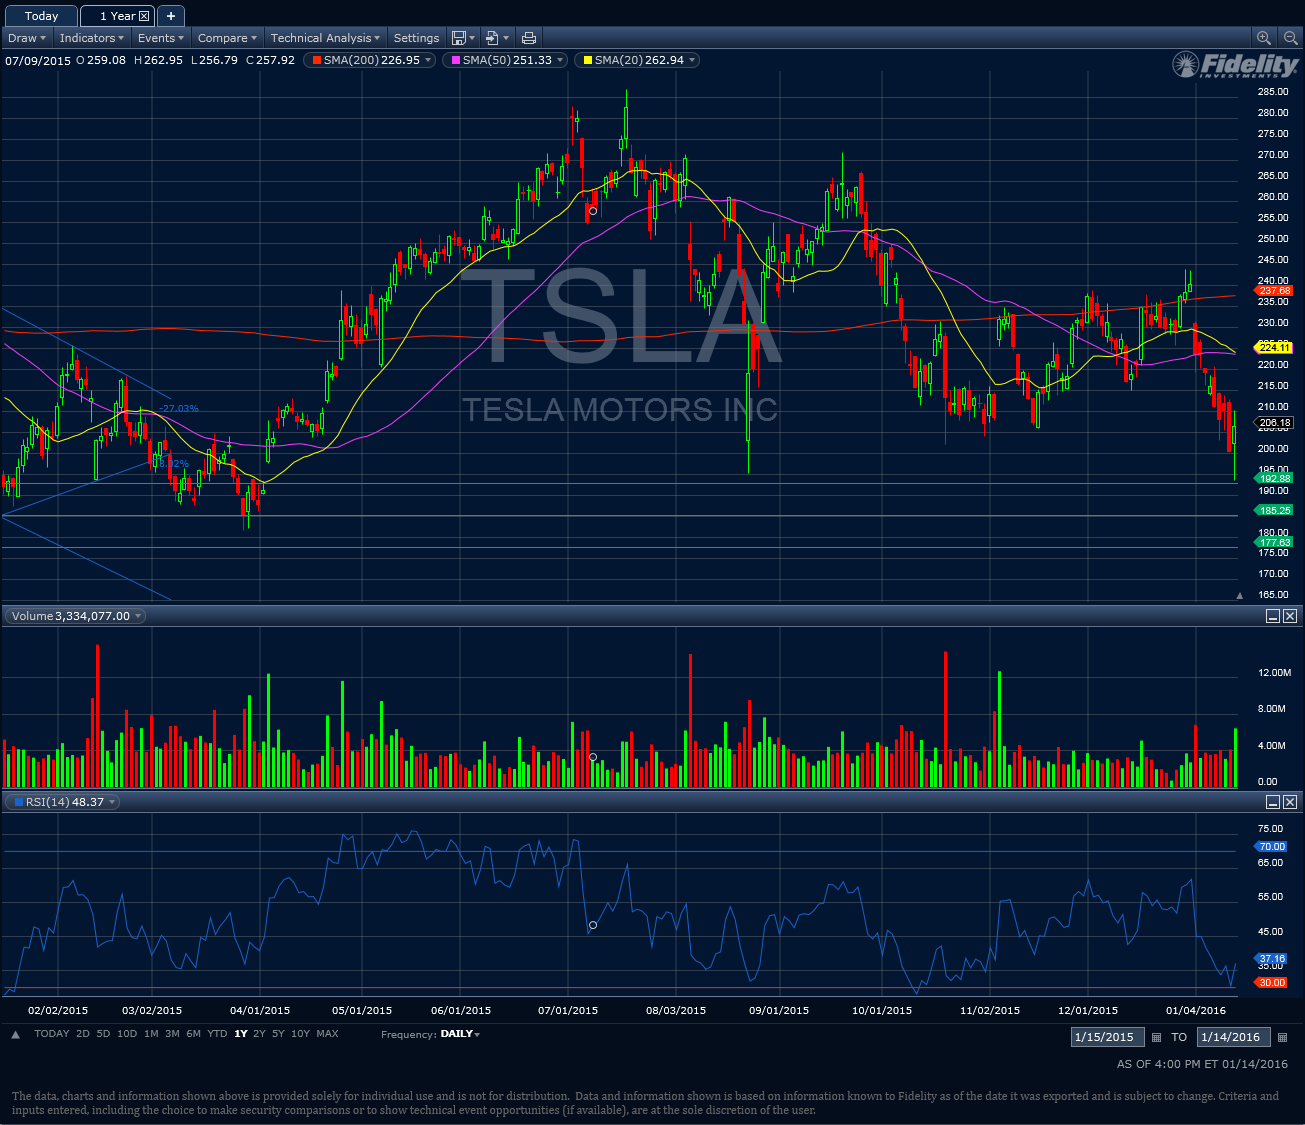
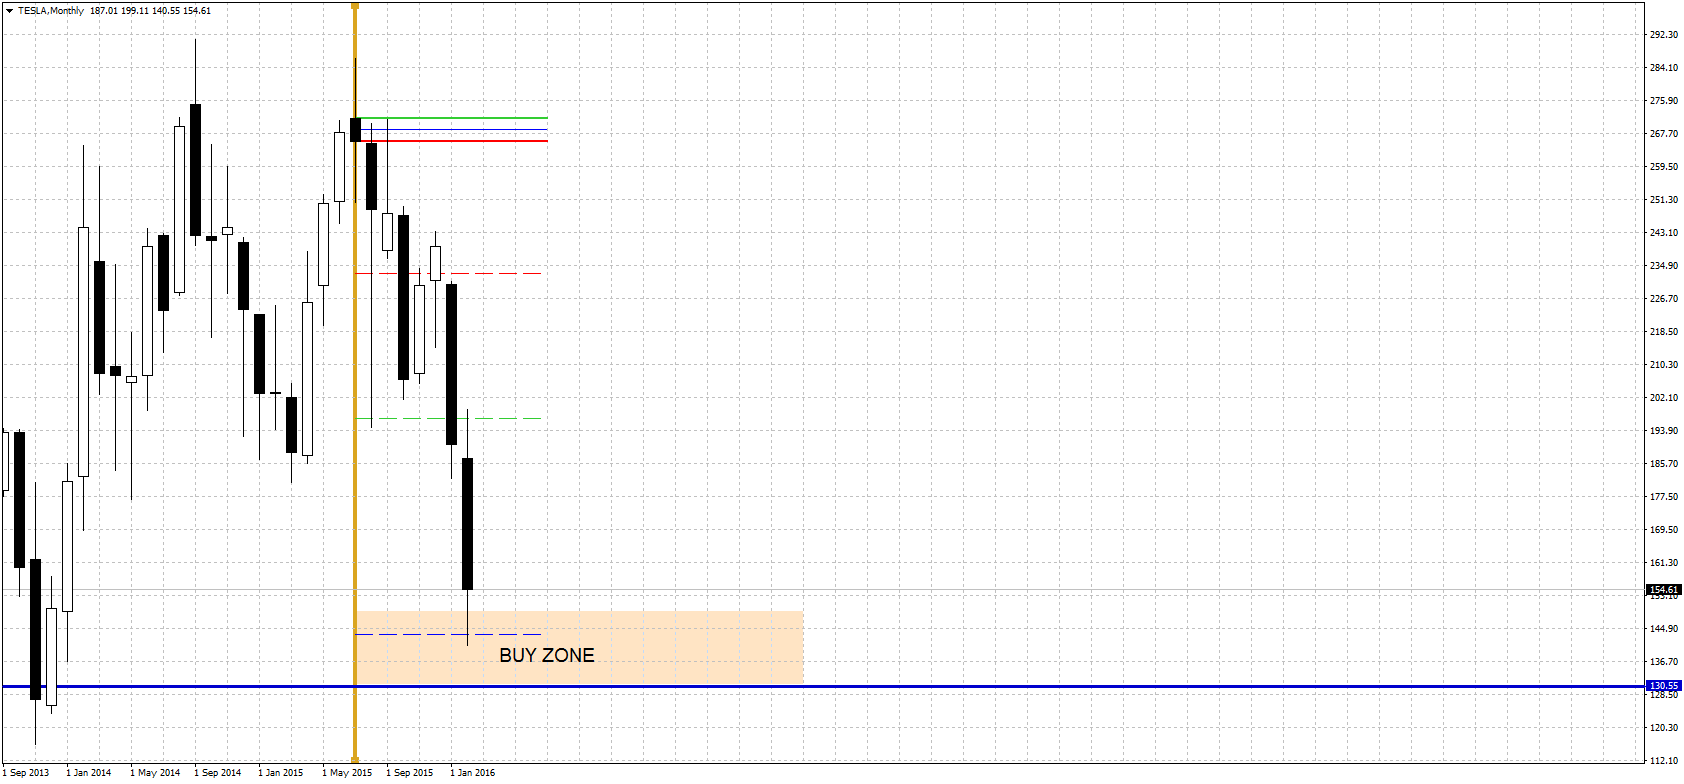
maoing Latest TA updates. Some observations:
1) close green with long needle and with volume, it's a sign of bottom;
2) RSI just hit 30 yesterday, it's sign of oversold, i.e. short term bottom at minimum;
3) today's LOW is double bottom pattern with 08/24 LOW, so SP can only go up from here to 270/290 level in next several months before breaking 300;
 �
�
Jan 14, 2016
mmccord So we have another unicorn setup?�
Jan 15, 2016
dalalsid More like double hump camel setup. Neck coming up.�
Jan 15, 2016
Bgarret Thanks for the very clear update Maoing. Good luck.�
Feb 1, 2016
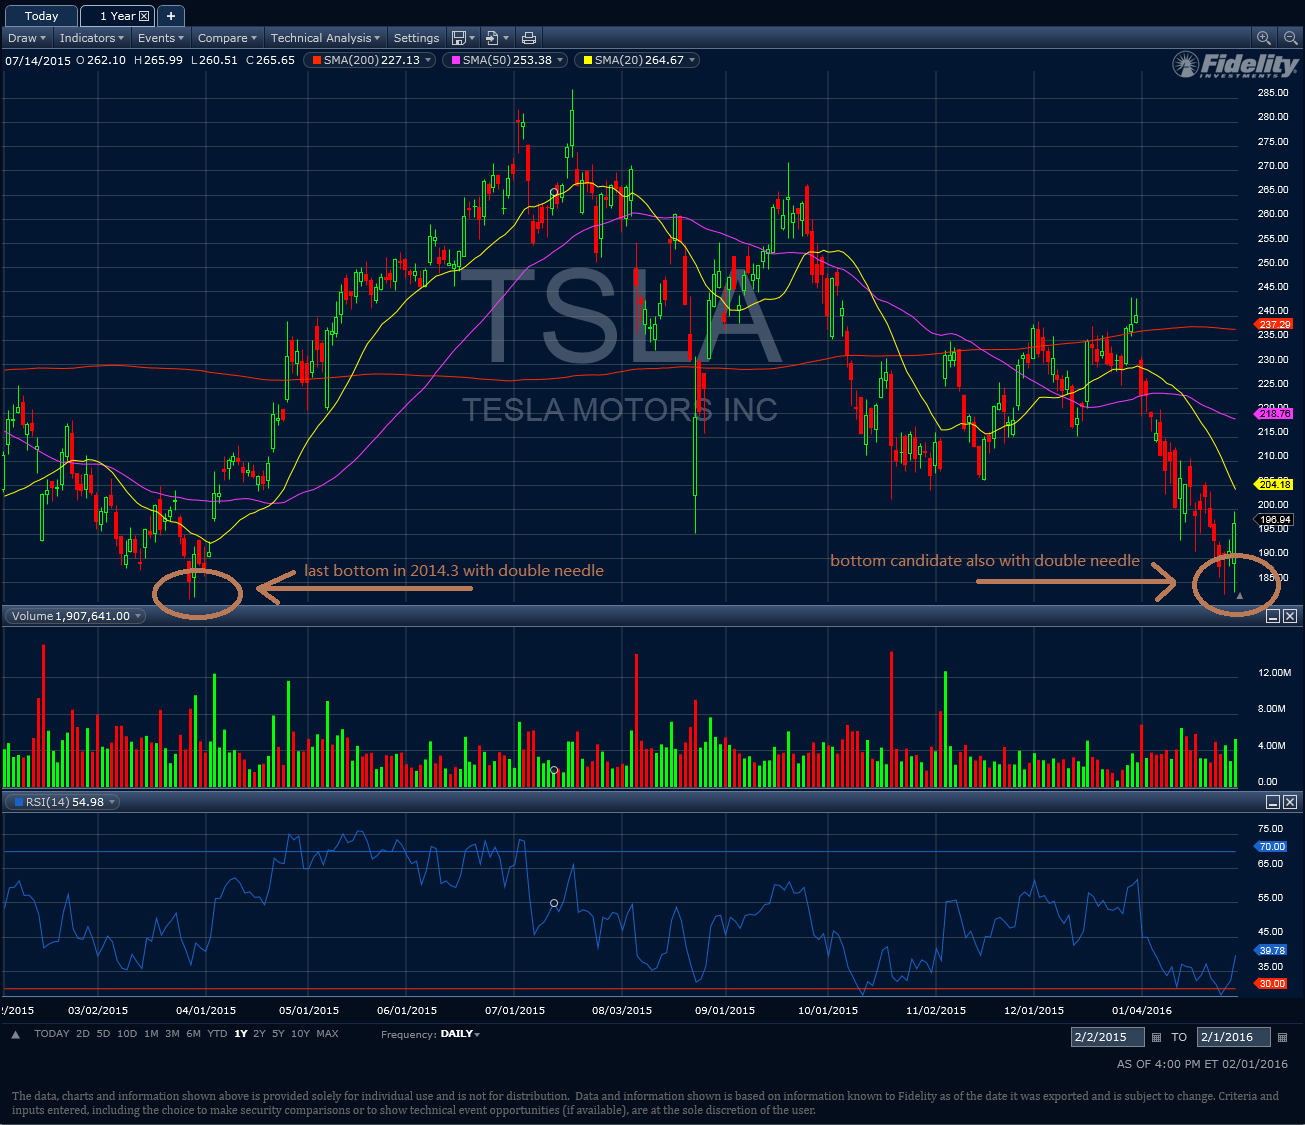
maoing TA updates:
1) double needles right above 180, which mirrors last bottom in 2014.3, but volume is not big enough
2) depends on the ER, we might revisit 180 or even sub-180 briefly before moving up towards model 3 catalysts
 �
�
Feb 2, 2016
Gerardf If I interpret the time of your posting correct, this is was posted before market open yesterday. A very accurate prediction !
Now hope the other part os your prediction also delivers.�
Feb 4, 2016
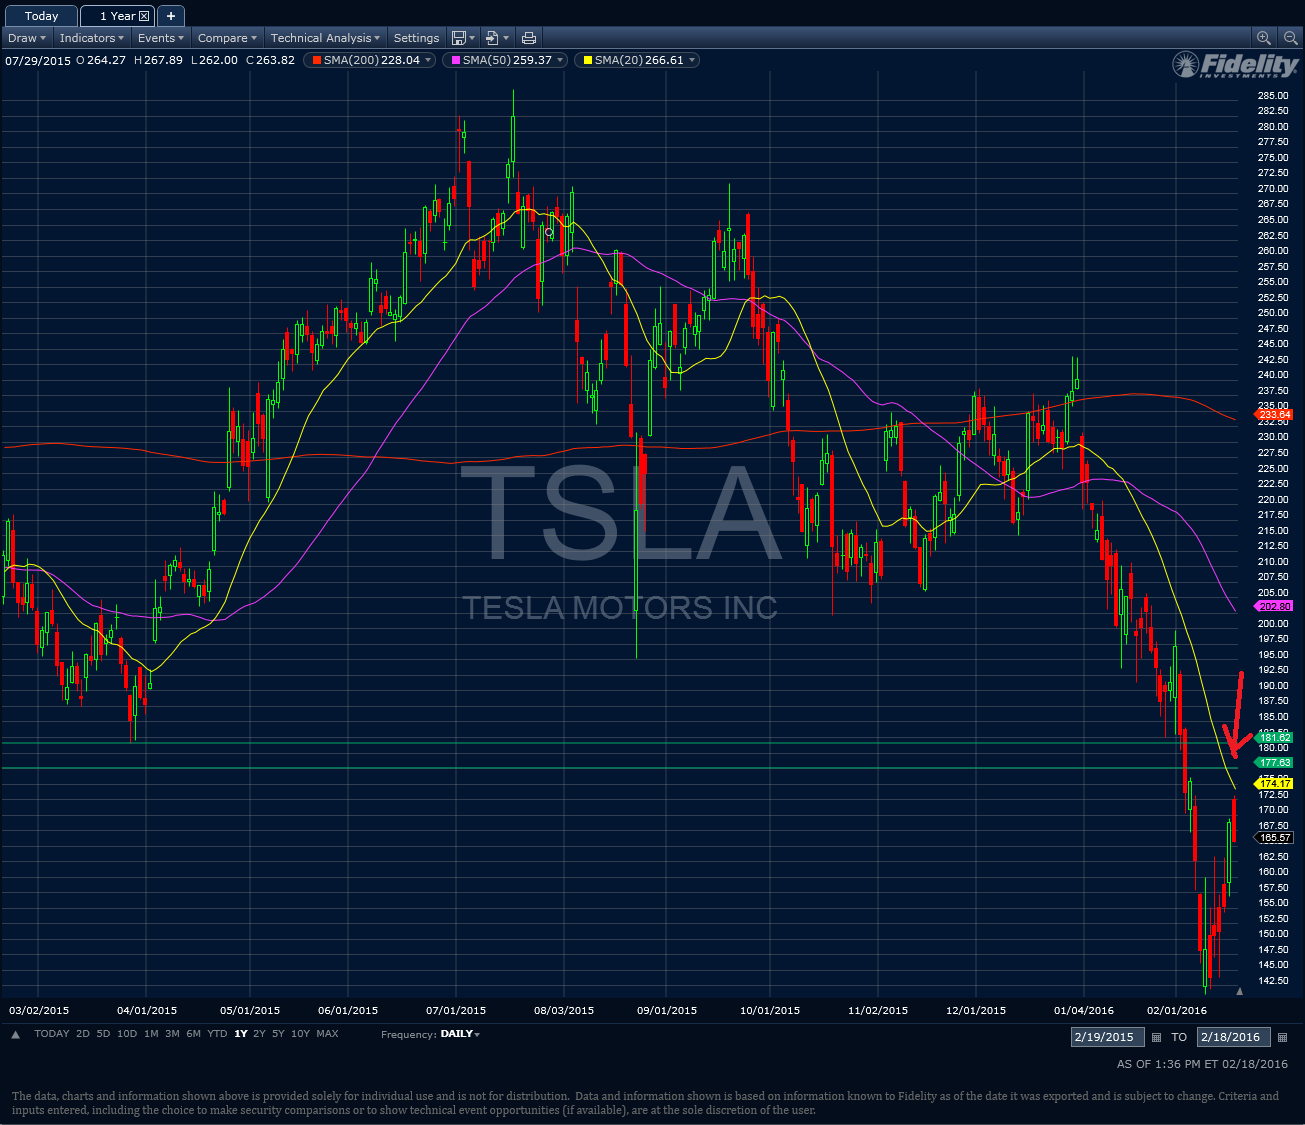
highend $135
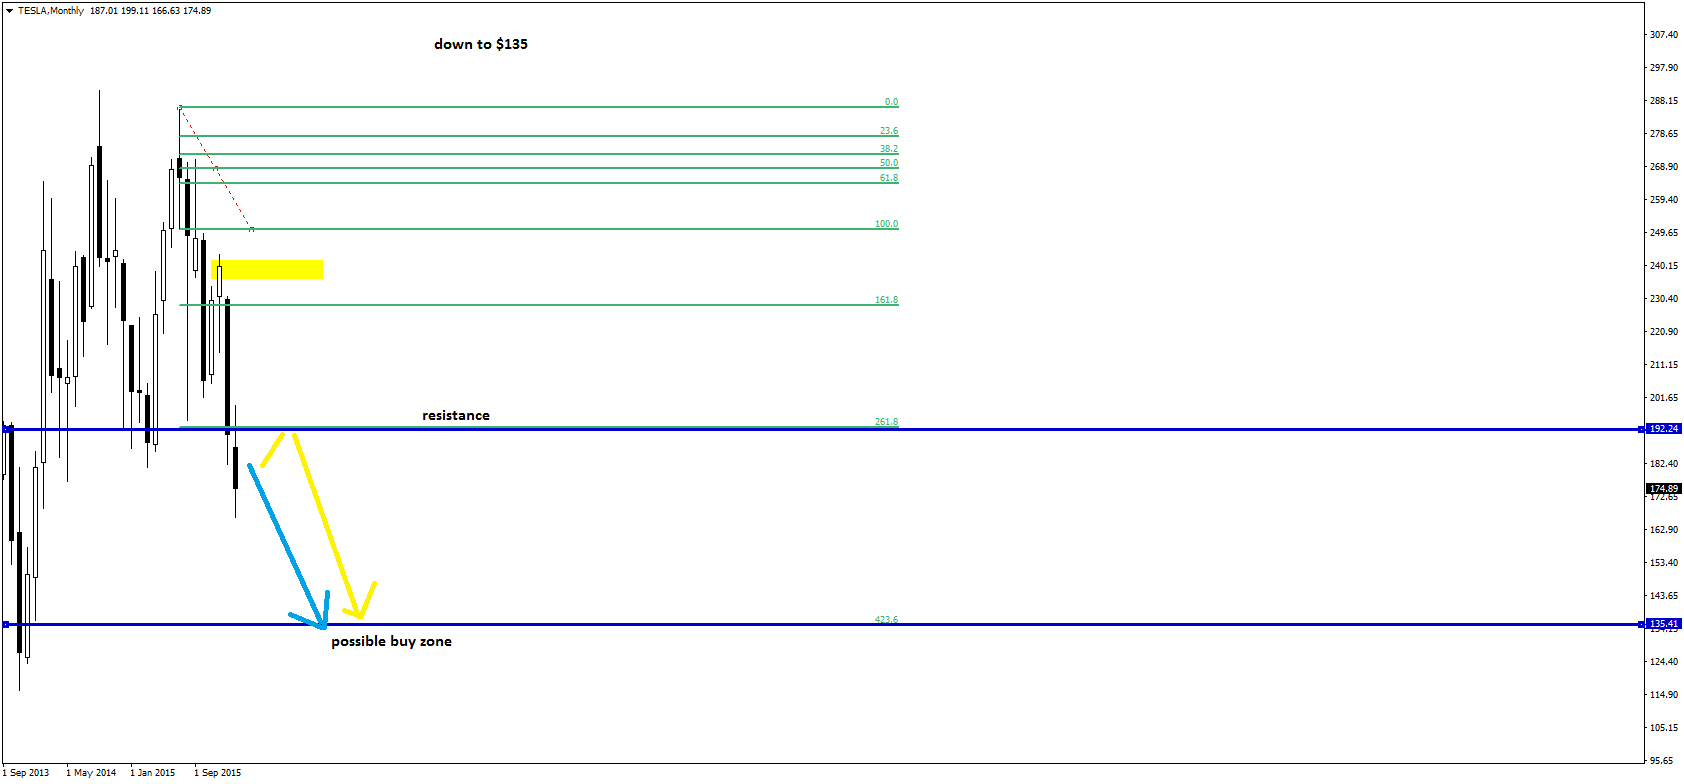
if we go up then at $205 is very strong resistance (not shown on my chart) - I would sell there as trend is down.�
Feb 4, 2016
Yonki Yikes. All I can say to that is thank goodness TA hasn't been calling it accurately of late.�
Feb 4, 2016
sundaymorning Read the above post. An analyst using TA says we could go up and In the same sentence says we "might" go lower. Give me a break, just flip a damn coin, then chart it on a graph, call it a "coin toss analysis" it'll likely yield the same result. 50/50�
Feb 5, 2016
Renaud If I read correctly High End post, if it's its analysis you're pointing at, he says we're in a downtrend, but can imagine there will be a short relief rally that will be stopped at 200, before plunging back, and sees a bottom in the 130's...�
Feb 5, 2016
Gerardf Sorry, wrong tread..�
Feb 5, 2016
sundaymorning In the face of earnings coming up, common sense is needed. Either a slow progressive upswing or slow declining movement followed by sharp up or down swings After ER. ER is coming, this is "common sense analysis." Now couple that with how jobs and the macros affect this stock and it's a coin flip day by day in the absence of news or available of future news.�
Feb 9, 2016
highend today
TSLA: Summary for Tesla Motors, Inc.- Yahoo! Finance
$141 premarket.
135 very close.... If you want to buy - your decision. I would wait.�
Feb 10, 2016
Electrifying Assume tomorrow TSLA gaps up at $157 and close in the 160's, where do you guys see this uptrend ends? Consider we had a steep slide down from the 240's, I say we have very little resistance back up. The first resistance I see is $200, then the $230 down gap may be where the uptrend ends. Thoughts?�
Feb 10, 2016
dmunjal I think 180 is strong resistance just like it was support for some time. I say the best you can expect in the near term is mid 170s.�
Feb 11, 2016
FluxCap What do you chartists think of this price action vs. macro?�
Feb 11, 2016
dmunjal It held 140 yesterday and 150 today. That's a sign of rebuilding a very damaged chart. 180 is all but impossible unless we get some really good news. I think 120 is also improbable unless macro takes another hit (China devaluation).
Looks like a new range of 140 to 180 until next earnings, positive FCF, or MX delivering in volume.�
Feb 16, 2016
highend If I was correct:
But I would rather wait than buy. When blue line is broken then TSLA will fall much lower and every UP will be great for shorts... but not yet�
Feb 16, 2016
drinkerofkoolaid What we need now is an epic Inverted Head and Shoulders. 0% APR in China is huge. All we need is for analysts to comment on China, or for Tesla to announce who it's China partner(s) will be and when we can expect a second Gigafactory. Elon reaffirmed expectations of producing 500,000 vehicles annually by 2018-2019. Tesla will need a second Gigafactory by 2020. Panasonic announced today that it is upping its acquisitions to prepare to increase production for Tesla. Why wasn't this reported by anyone?�
Feb 17, 2016
dmunjal How high can we go this week before we run into some serious resistance? Can we break 180?�
Feb 17, 2016
AlMc I would like to see $180.....It will take some really nice macro tailwinds OR a small short squeeze. The former, IMO, is more likely than the latter for the two remaining trading days this week.�
Feb 17, 2016
chickensevil I'm sorry but who looks at more than a weekly chart to see how things are trending? Are you really basing us falling to 135 on something that happened over two years ago?�
Feb 18, 2016
maoing Two possible bounce high from TA chart:
1) between 177 and 181 which are the two lows of 2014.5 and 2015.3;
2) MA5, today is at 174 and we might already reached this morning
Barring no substantial model X and model 3 news coming in short term. It's likely to see SP pull back to 150-160 range IMHO.
Btw, I sold 80% of my position before closing yesterday and @ opening today. Will try to buy them back if it can reach 150-160. If SP dropping to 140ish or lower again, I'll use the profit from "sell high buy low" to buy some weeklies/monthlies betting good X/3 news coming in in March.
 �
�
Feb 18, 2016
Zhelko Dimic Thanks for sharing!
Nice to see actions of someone who more aggressively maintains his position than I do.�
Feb 19, 2016
highend Q: who looks to weekly chart to see how things are trending?
A: ME
Why? Because I know how "trend" is working and proceeding.
I don't know if 135 is target or lower... or low (140) was actually LOW and opportunity to buy. Time will tell.
I can see trend range (and turning points) using weekly or monthly chart. TSLA is too young for monthly anyway.
Too much to explain how it works. I tried to several people but they didn't understood.....
So - be patient�
Feb 28, 2016
dmunjal As a short term trader who bought in the 140s during the last downturn, I'm looking to sell soon.
I follow Fibonacci levels and it seems we hit 50% of the recent high of 270 when we went to 135. A 50% retracement of 135 should put us in the 200 range before hitting a wall.
Is this a good approach? I think we hit this level this week which will give me an opportunity to reenter when we retest 180 again.
BTW, I'm only using options.
Thoughts?�
Feb 28, 2016
Cattledog dmunjal - I think your strategy is at the mercy of the TSLA PR machine (known as Elon tweeting and mysterious invitations to highly anticipated parties, Model 3 and Gigafactory). All you said could happen, but we also may have waved goodbye to 180. I don't know, I would hate to be caught on the sideline waiting for 180 with the type of anticipation that's likely building.
I don't use TA, but certainly appreciate what others offer. I have a few wires upstairs that help me see things at times (and miss them at others).
Short-Term TSLA Price Movements - 2016 - Page 452
Hits $141.05 that day for the low of 2016. I hope.�
Mar 7, 2016
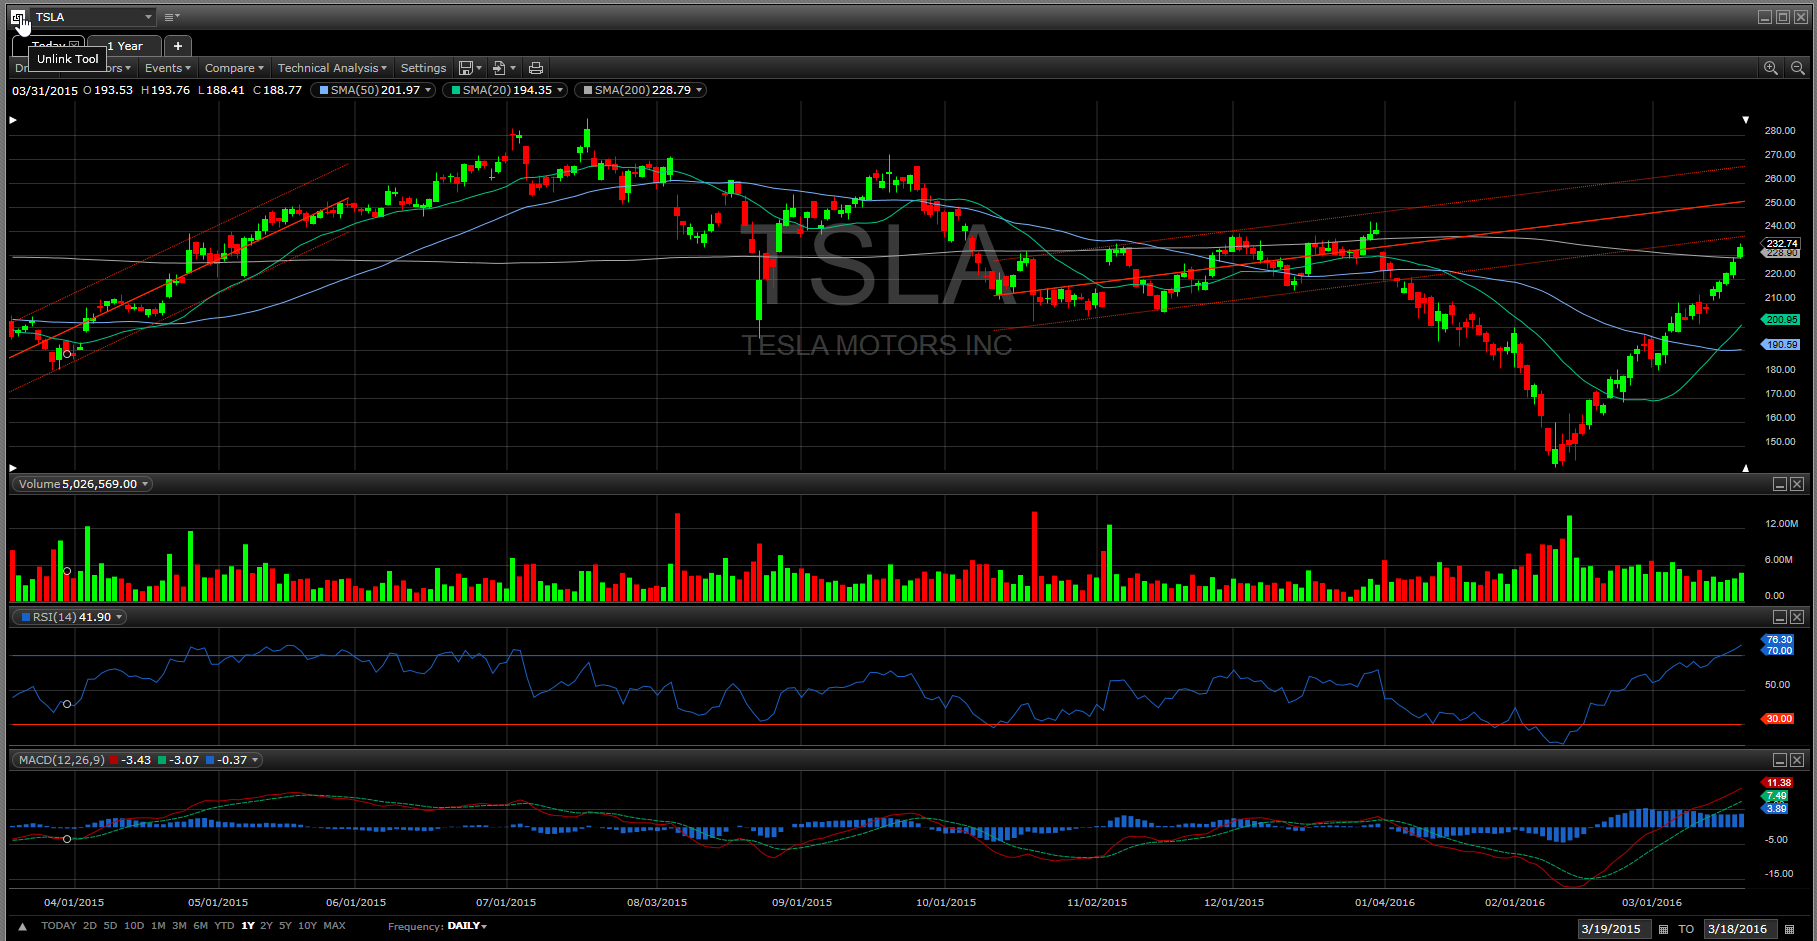
austinEV It seems we have cleared the 50day. Next resistance 230? (200day MA). Seems nothing between here and there.�
Mar 7, 2016
jesselivenomore 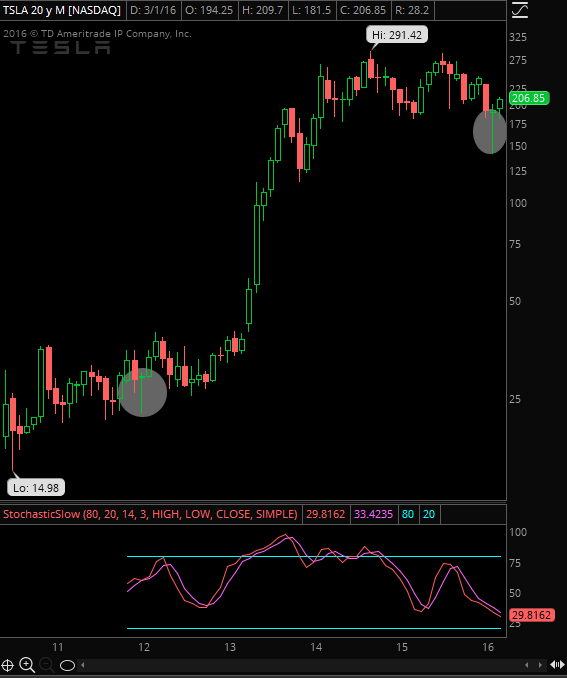 �
�
Mar 7, 2016
maoing The big inverted hammer happened in last august too. It not necessarily means the inversion of long term trend. From monthly chart, TSLA still under down trend channel. But, yes, short term it might look bullish. It would be interesting to see if march reproduces last september chart with "hammer".�
Mar 7, 2016
jesselivenomore A hammer needs to close at or above the open price of the candle with a long tail. Also, as an indication of capitulation, it needs to come at the end of a trend. Last August did not fulfill either of those criteria. It came at the top of a trend(which makes no sense in the context of a capitulation), and did not close above the open price. This is why I posted on 2/29 that where we closed that day was so significant - it determined whether the monthly candle would qualify as a hammer or not.(a few points lower and it would not have, it was up in the air until the very last day of the month)�
Mar 7, 2016
maoing I think it's inappropriate to stick with monthly open and close. Aug fall happened in the second half while the Feb fall happened in the first half, so Feb recovery has much better chance to see "close above open" from monthly chart even the recovery magnitude is similar. It just matters sliding window you choose. What I'm trying to say it's risky to turn into bullish based on single month performance. especially TSLA has habit to have big run up followed by big correction like 8/9/10 in 2015. Also the macro and fundamental doesn't support bullish at this point.
�
Mar 7, 2016
vgrinshpun Assuming that reversal of the trend pans out as you see it (my understanding that your criteria is breaching $220 level on a high volume), do you currently see any information that could indicate possible range for the top of the forming uptrend (in terms of SP and/or time frame)?�
Mar 7, 2016
jesselivenomore A hammer, or any candlestick pattern, is based on open and close by definition. It is fine if you believe TSLA has a propensity to correct after a large rally(most things do), but you cannot call last August an inverted hammer because by definition it was not. And that is the value of identifying patterns to begin with - while most of the time large rallies in any stock is followed by corrections, in the case after a reversal hammer you are looking for further continuation to the upside. That does not mean that upside is guaranteed, patterns fail sometimes. Which is why I have been saying - if we continue to the upside here it will be a confirmation of the hammer(I will add to my long), if we fail here I will sell.(below 180 roughly)�
Mar 7, 2016
jesselivenomore There is resistance at 235-40 and 280, both of which I believe we would consolidate at or pullback from. But the key takeaway from a break of 220 on high volume(average volume the past month has been over 5.5M, so IMO 9M will be necessary) is that, as you said, the trend would be reversed. So this means that even as we pullback from these resistances, I would be a buyer as long as we stay above 180, and expect us to eventually break through these resistances. Although to trade above 280 we will need fundamental(cash flow) confirmation. Technicals is merely a visualization and reading of buying and selling flow - realized as price action. And price action usually precedes and leads fundamentals since the stock market is speculative in nature. So yes we need fundamentals to confirm an uptrend, but by the time that happens share price will already be much higher.
If we fail to break 220 and pullback, I would not be a buyer because the reversal would not be confirmed and the downtrend could continue. In fact I would be a seller below 180.
That said trading based on technicals is all about degrees of probability. It is not about betting the farm on any one setup, but rather continuing to replicate them while minimizing your losses, and profiting from an edge over time.�
Mar 18, 2016
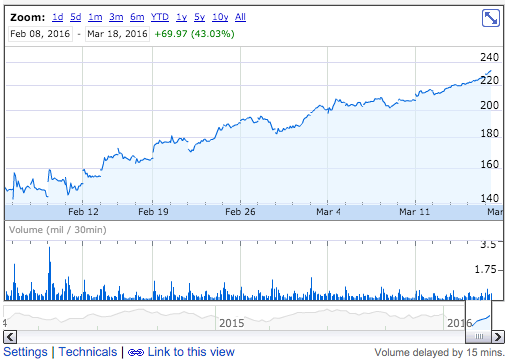
Familial Rhino I know nothing about TA and I don't consider myself a good trader, so I'm curious what experienced traders think about a particular aspect of the picture below.
We can see that once the stock hit the most recent bottom, it went through a brief phase of turbulent stagnation, then after Feb 12 it started to rise. What strikes me is that the choppiness of the rise was highest at the beginning, after which it progressively started to smooth out. Over the last week, the rise almost became a straight line (on this logarithmic scale). At the same time, volume hasn't increased, and it may have actually decreased a little.
I am interested in an interpretation of the plot in terms of presumed behaviour of the the trading crowd that's behind it (hopefully without the TA terms which I'm not familiar with). Of course, this could only be speculation, but informed speculation on what the progressive smoothing on lower volume might mean would be appreciated. Maybe also throw in a guess about what this could mean for the next two weeks before the Model 3 reveal.
(I now see Jesse is still banned. That's too bad.)
 �
�
Mar 18, 2016
Familial Rhino It's worth noting that something similar seems to have happened to the NASDAQ. Could it be that most of TSLA's recent rise is mainly due to the macro fears slowly subsiding, and we're just recovering from being oversold, as Julian suggested? Could the fading of macro concerns explain not only the rise, but also the smoothing in TSLA?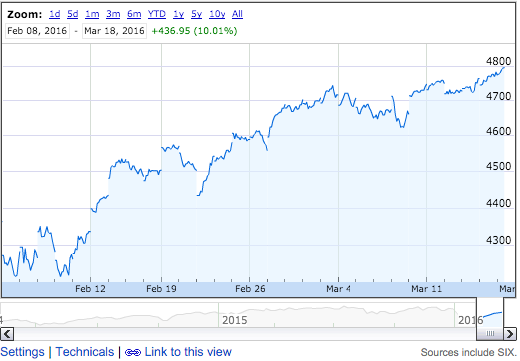 �
�
Mar 20, 2016
vgrinshpun The TSLA chart is currently quite interesting. We just broke the 200 day SMA, and seem to be poised to close the $240 gap from 12/31/15 - 01/04/2016. This will bring us up into the October-November-December regression channel. The 20-day SMA had crossed the 50-day SMA last week, and gap between them is still increasing, with a slow and steady increase in volume through the last week. All of the above is unfolding on the background of macro tail winds with the same trader who predicted oil dip to $26 last November, is speculating that current oil climb will continue until it hits $49 (I know - the enthusiasm about the oil price action seems pretty irrational to me - but what do I know...)
I am in the process of setting up time delayed spreads (bought lower legs - Jan 2017 $190 and $220 and April 15 $230 - all green now). My original plan was to sell upper legs as we close the $240 gap, but I am wondering whether it is more likely at this point that as TSLA closes the $240 gap and runs into the old regression channel, it might continue the run-up to the $260 resistance point.
Anybody wants to share their thoughts on this?
 �
�
Mar 21, 2016
chickensevil Well, you have your gap close, the highest trade today was 239.88. I assume that is close enough right?
On the technicals side we have also basically completed the V shape today, so I would assume that people are piling in on both sides right now to trade on us going up or returning back to the downside. This is likely the reason for the immediate sell off right as we neared 240 and is further evidenced by people reporting that there are no shares left to short on their brokers.
Chart could basically go either way, but in order to actually keep going up, we need to fully break the 240 level. That might be tough since shorts clearly jumped the gun here to keep it from going on up over 240 and creating the more bullish signal.�
Mar 21, 2016
highend $140 was DIP and low and target for downtrend. My range seemed even $135 but on monthly chart the $5 really doesn't matter.
Don't look where is upside... Sky is the limit and trend is UP
I have resistance: $247 and then... $306 another step, and $370-390 target in my system.
and what I think is - we go to $290 (previous both TOPs), we break to $306... where many people will BUY and they will be pissed, then we go back to $250 area
But don't think and trade - just trade�
Mar 21, 2016
austinEV With the exception of the Feb Freakout, we traded between 280 and 180 for 2 years. The 200 day SMA was stuck almost flat at 230-240 for 2 years. We have just reverted to the long term median, with more reasons to be optimistic than in any previous period. We cleared the 200 day. I see zero reason to not trade above that, between the 200 day and the defacto ATH of 280. News will push us above, but there are many such potential news events.
It seems hard to imagine now, but stock prices justify themselves. I expect TSLA to have BUZZ. If The Car is attractive, that will be IT. Specs we basically know now. People will be buying and selling TSLA for 280, 290, 300 and why not? With new reservation numbers coming out every day in April, the company will feel like a different proposition with a new forward valuation.�
Mar 23, 2016
jhm Do we have any technical analysis folks looking at the oil market? I'd love to have some TA input in the Shorting Oil, Hedging TSLA thread. I view oil as range bound on fundamental grounds, but it would be nice to have some TA commentary too.�
Mar 23, 2016
drinkerofkoolaid The only thing technicals can tell us about the oil market is that $25 is an absolute bottom. I think Oil will be $100-$150 a barrel once the glut works itself out, more oil companies go bankrupt, and speculators and regulators begin to price in externalities. It it's not in anyone's interest for oil to be anywhere near $25 a barrel.�
Mar 30, 2016
drinkerofkoolaid If this is an inverse head and shoulders, isn't the extent (length) of the rally usually a function of the length of the base? This looks like perfect consolidation ~$230.�
Apr 1, 2016
neroden Couldn't give you a technicals on oil, but to chime in with drinkerofkoolaid, fundamentals say that there's no way oil stays below $30 for long. Under $30, *all* new drilling is unprofitable with the exception of a few Middle Eastern sites.�
Apr 1, 2016
Familial Rhino This LA Times article manages to spew more methane than the recently sealed Aliso Canyon leak.�
Apr 3, 2016
dc_h Strange that the LA Times would have such an overwhelming negative bias against the second largest private sector employer after Disney and the fastest growing major employer. Their disdain for Elon is worse than Cory Johnson and seems like a well funded more articulate Serking Alpha. Inconsistent use of facts, questioning AP as if it didn't already exist and noting the "huge" GM response to the EV market, apparently making Tesla irrelevant or unneeded.
What's up LA Times? Why do you hate the states most important manufacturing and engineering employer?�
Apr 3, 2016
jdw Not to mention, referencing the Teslerati poll of people who had one or more drive units replaced. A total of 242 responses where zero drive units replaced was not an option, nor was mileage or manufacture date indicated. Weak.�
Apr 3, 2016
Bgarret I don't remember what thread it was on, but someone's relative worked for the paper and said that the entire editorial staff detested Elon and that there would not be a positive story related to Tesla, SpaceX or Solar City under this regime. If you see LA Times, read Wall Street Journal West Coast....avoid unles you have strong decontamination and delousing readily available.�
Apr 3, 2016
AndreN I've got a joke I keep telling myself that if Elon cured cancer, the LA Times story about it would be entitled: "Elon Musk puts thousands of doctors out of work".�
Apr 3, 2016
MikeC They would also quickly point out all the billions the government will have spent "subsidizing" Elon's cancer research. Why couldn't he just stick to free market principles? The bears on SeekingAlpha will quickly point out that if there really was any demand for a cure for cancer, someone would have supplied the cure already. That's how efficient markets work, right?�
Apr 3, 2016
Fallenone Wait, is this the TA thread?�
Apr 3, 2016
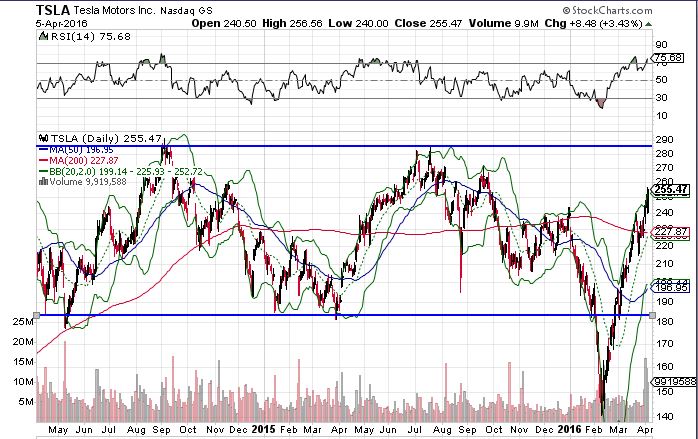
AndreN Yeah, sorry I went off topic. I'm not a TA expert. I do see that looking at TSLA's chart, we crossed and closed above the 200 day average Friday on high volume. Isn't that normally a bullish sign?�
Apr 3, 2016
Bgarret Sorry - some of the fault is mine. I am also no TA maven, but as Curt Renz often talks about the difference between modeling charts with a normal company and a fast-growing disruptive company, I'm going to throw out a TA-busting hypothesis. Most of the TA description of a cup-and-handle chart formation stresses the rounded, flat base at the bottom. Many are quick to say that a V-shaped cup lessens the predictive nature of the chart.
Fine.
But within the context of a momentum stock like Tesla and a historically poor macro market (worst on record, worse than 1929, 2000, 2001, 2008, 2009...worse than ever) if you squint, can't you see a more textbook cup-and-handle formation, distorted by macro to V-shaped, now responding/resolving to the upside as you would expect?
I dislike TA. Seems a little Ouija board to me...that being said, take a look at High End out of Poland. He's gotten his share of grief for his posts but post 469 on Feb 4th and # 502 on March 21 are interesting reading.
Good luck to all - should be an interesting week. Look forward to the TA experts and what they see in the tea leaves.�
Apr 4, 2016
austinEV Yeah I owe the cup-with-handle theory an apology. It is working out as predicted.�
Apr 5, 2016
Electrifying on 30 minute chart, 238 area is trendline support and if the trendlines stay intact, I think we may see 255 by Friday.�
Apr 5, 2016
Ulmo 1. That chart is bigger than the Model 3 event (chart too big? i.e., another chart since then?)
2. That chart is high on the right because of the Model 3 event (chart too small? i.e., a chart that smooths out Model 3 hump?)
Model 3 was "priced in", and now has "confidence of demand", so I'm not sure how those play out in future compared to the whole company. And timing is weird: problems we all saw in January just hit the stock last night, even though the stock has been raising for two months out of that whole BECAUSE we all saw those problems getting solved. So, there's people who already saw things happen building into stock AND people who are just learning of things that are past building into stock after the first people.
I'm a novice here, so just throwing in my 1 cent.�
Apr 5, 2016
austinEV This is how I think of the current price action:
(2 year daily chart). The story couldn't be simpler. With less good news to consider, we traded between 180 and 280. We had a Feb crisis of faith/Macro driven downturn, but we haven't even retested the old highs. Now is a reasonable time to break through and find new highs based either on new engagement from investors learning about the M3 or improved financials some time this year.�
Apr 5, 2016
Electrifying Wow, reached $255 3 days before my prediction!�
Apr 6, 2016
NOLA_Mike Based on my understanding of a V Bottom Chart pattern this is my thinking:

A measured move off the V Bottom to $290 with the trend continuing up after meeting the target price.
Thoughts?�
Apr 6, 2016
hershey101 Looks good... Also $290s is the ATH so that'll definitely act as resistance.. If you want to play this, I might recommend waiting a bit as prices stabilize and consolidate around $250s before buying options (unless you plan on getting LEAPS) that way you can maximize your profits. Also get out ~$5 or so before your price target (eg. maybe $280-$285)...�
Apr 6, 2016
Jonathan Hewitt I was thinking the same thing before I read this thread today, so maybe a lot of people are thinking the same thing and it will play out that way. Probably a smart area for people to sell short and medium term calls if they still have them at that point or hedge them by converting to spreads. I'm thinking it will take the ER in May to go to ATHs but who knows.�
Apr 8, 2016
NOLA_Mike It has also been pointed out to me that that chart pattern could just as easily be an inverse head and shoulders and if that's the case then the neckline is at 240 (instead of 215) and the implied measured move would be to ~340 instead of ~290.
My plan is to either lighten up a little bit or hedge with options when we approach the ATH of $286-$287.�
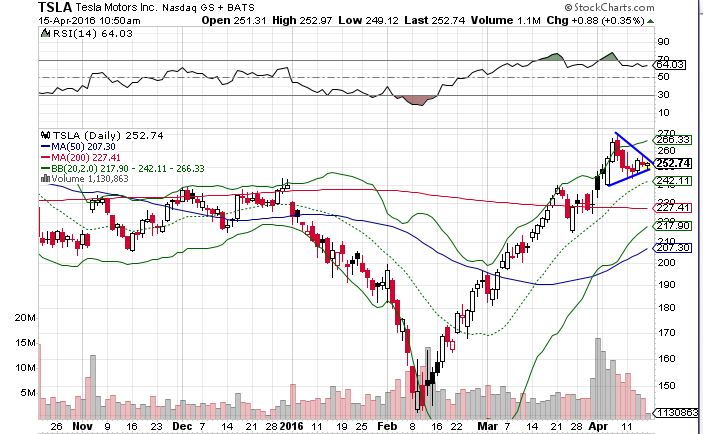
Apr 12, 2016
vgrinshpun Well, the interesting part is that TSLA seem to settle right back into the (10/12/2016-1/04/2016) regression channel. Very curious to see if it will follow it. It looks like it just got back on track after violent and swift "V" bottom. I am still holding my Jan 2017 $190 and $220, hoping to sell the higher leg of the spread as we bump against the upper boundary of this channel within the next couple of weeks. We do seem consolidating in the lower half of the channel on decreasing (since bursting into the channel) volume.
 �
�
Apr 12, 2016
austinEV All signs point to a 240 support level. I am looking at the fact that it is the same as a lot of recent tops and also happens to be the 20day:

Also happens to be the bottom of your regression channel. I think I will look at it to find support there and confirm up and buy back in harder. I did a pretty good job of acting on a top for once, trying hard not to get back in too early as I love to do so much.�
Apr 12, 2016
austinEV
Another fun thing to note. The 50 day is approaching the 200 day slowly, A "life cross". In hindsight bailing on the previous death cross would have been a good (if early) call. That life cross might happen about Q1ER.�
Apr 12, 2016
drinkerofkoolaid This looks like the definition of a bull flag, approaching the edge of the triangle ~$245 on low volume. Took 3 sellers for my medium size limit buy order to execute. Volume usually kicks in ~1:30. Lets were what happens.
It's also possible the market is focused on SolarCity today, and is waiting to see if it can get above $30. If SolarCity breaks above $30 with significant volume, a ton of shorts will probably cover. The SCTY shorts haven't budged, IV is near record lows even though options imply a big move should happen soon, and the stock is fundamentally and technically very oversold.�
Apr 12, 2016
Fallenone I think the V invalided the channel. A new channel was formed from 140 to now. Still intact I think.�
Apr 13, 2016
drinkerofkoolaid All charts seem to point to ~$285 as the top of the channel, and the next major resistance point. Thoughts?�
Apr 13, 2016
austinEV I think you should post charts or something that support that and we can chime in.�
Apr 13, 2016
NOLA_Mike That coincides with the V Bottom analysis I posted up thread.
Having said that I don't feel the pattern is as strong as, say, resistance lines, support lines, trend lines, etc. But it does coincide with the all time (and 52 week) high around $285-287 as well.�
Apr 14, 2016
Electrifying Agreed to this refound channel, looks like we found support on the lower trendline, $275 should be reached with a week or so.�
Apr 15, 2016
austinEV Possible Bull pennant or Wedge:
I may have to take a stronger position by the end of the day for a little break out.�
May 2, 2016
Curt Renz TSLA's simple moving average of 50 days crossed above the one for 200 days this morning. That's a bullish signal. In my book I showed example charts with 10 and 20-day SMAs for shorter term traders, but the same principle applies for the implications of lengthier SMAs as noted in the summary at the end of my moving averages chapter.�
May 9, 2016
Curt Renz $205.195 would mark a 50% retracement of the rise from the intraday low of $141.05 on February 9th to the high of $269.34 on April 7th. Such a retracement is often a setup for strong a return to the upside. It need not be exact. Today�s low of $206.80 could well have been sufficient.�
May 10, 2016
austinEV I certainly hope so.
My new rule is not to get in until "it has stopped going down". Which means I will miss some upside. I love knife catching so much!�
May 16, 2016
austinEV goodness, quite the crisp bottom support level at 207.�
May 16, 2016
NOLA_Mike Someone else pointed out on another thread that this neighborhood is also a Fibonacci retrace support level as well.�
Không có nhận xét nào:
Đăng nhận xét