Apr 5, 2016
Electrifying Wow, reached $255 3 days before my prediction!�
Apr 6, 2016
NOLA_Mike Based on my understanding of a V Bottom Chart pattern this is my thinking:

A measured move off the V Bottom to $290 with the trend continuing up after meeting the target price.
Thoughts?�
Apr 6, 2016
hershey101 Looks good... Also $290s is the ATH so that'll definitely act as resistance.. If you want to play this, I might recommend waiting a bit as prices stabilize and consolidate around $250s before buying options (unless you plan on getting LEAPS) that way you can maximize your profits. Also get out ~$5 or so before your price target (eg. maybe $280-$285)...�
Apr 6, 2016
Jonathan Hewitt I was thinking the same thing before I read this thread today, so maybe a lot of people are thinking the same thing and it will play out that way. Probably a smart area for people to sell short and medium term calls if they still have them at that point or hedge them by converting to spreads. I'm thinking it will take the ER in May to go to ATHs but who knows.�
Apr 8, 2016
NOLA_Mike It has also been pointed out to me that that chart pattern could just as easily be an inverse head and shoulders and if that's the case then the neckline is at 240 (instead of 215) and the implied measured move would be to ~340 instead of ~290.
My plan is to either lighten up a little bit or hedge with options when we approach the ATH of $286-$287.�
Apr 12, 2016
vgrinshpun Well, the interesting part is that TSLA seem to settle right back into the (10/12/2016-1/04/2016) regression channel. Very curious to see if it will follow it. It looks like it just got back on track after violent and swift "V" bottom. I am still holding my Jan 2017 $190 and $220, hoping to sell the higher leg of the spread as we bump against the upper boundary of this channel within the next couple of weeks. We do seem consolidating in the lower half of the channel on decreasing (since bursting into the channel) volume.
 �
�
Apr 12, 2016
austinEV All signs point to a 240 support level. I am looking at the fact that it is the same as a lot of recent tops and also happens to be the 20day:

Also happens to be the bottom of your regression channel. I think I will look at it to find support there and confirm up and buy back in harder. I did a pretty good job of acting on a top for once, trying hard not to get back in too early as I love to do so much.�
Apr 12, 2016
austinEV
Another fun thing to note. The 50 day is approaching the 200 day slowly, A "life cross". In hindsight bailing on the previous death cross would have been a good (if early) call. That life cross might happen about Q1ER.�
Apr 12, 2016
drinkerofkoolaid This looks like the definition of a bull flag, approaching the edge of the triangle ~$245 on low volume. Took 3 sellers for my medium size limit buy order to execute. Volume usually kicks in ~1:30. Lets were what happens.
It's also possible the market is focused on SolarCity today, and is waiting to see if it can get above $30. If SolarCity breaks above $30 with significant volume, a ton of shorts will probably cover. The SCTY shorts haven't budged, IV is near record lows even though options imply a big move should happen soon, and the stock is fundamentally and technically very oversold.�
Apr 12, 2016
Fallenone I think the V invalided the channel. A new channel was formed from 140 to now. Still intact I think.�
Apr 13, 2016
drinkerofkoolaid All charts seem to point to ~$285 as the top of the channel, and the next major resistance point. Thoughts?�
Apr 13, 2016
austinEV I think you should post charts or something that support that and we can chime in.�
Apr 13, 2016
NOLA_Mike That coincides with the V Bottom analysis I posted up thread.
Having said that I don't feel the pattern is as strong as, say, resistance lines, support lines, trend lines, etc. But it does coincide with the all time (and 52 week) high around $285-287 as well.�
Apr 14, 2016
Electrifying Agreed to this refound channel, looks like we found support on the lower trendline, $275 should be reached with a week or so.�
Apr 15, 2016
austinEV Possible Bull pennant or Wedge:
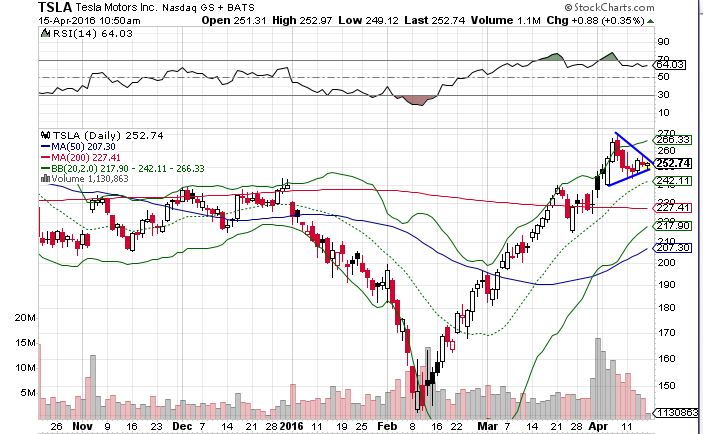
I may have to take a stronger position by the end of the day for a little break out.�
May 2, 2016
Curt Renz TSLA's simple moving average of 50 days crossed above the one for 200 days this morning. That's a bullish signal. In my book I showed example charts with 10 and 20-day SMAs for shorter term traders, but the same principle applies for the implications of lengthier SMAs as noted in the summary at the end of my moving averages chapter.�
May 9, 2016
Curt Renz $205.195 would mark a 50% retracement of the rise from the intraday low of $141.05 on February 9th to the high of $269.34 on April 7th. Such a retracement is often a setup for strong a return to the upside. It need not be exact. Today�s low of $206.80 could well have been sufficient.�
May 10, 2016
austinEV I certainly hope so.
My new rule is not to get in until "it has stopped going down". Which means I will miss some upside. I love knife catching so much!�
May 16, 2016
austinEV goodness, quite the crisp bottom support level at 207.�
May 16, 2016
NOLA_Mike Someone else pointed out on another thread that this neighborhood is also a Fibonacci retrace support level as well.�
May 20, 2016
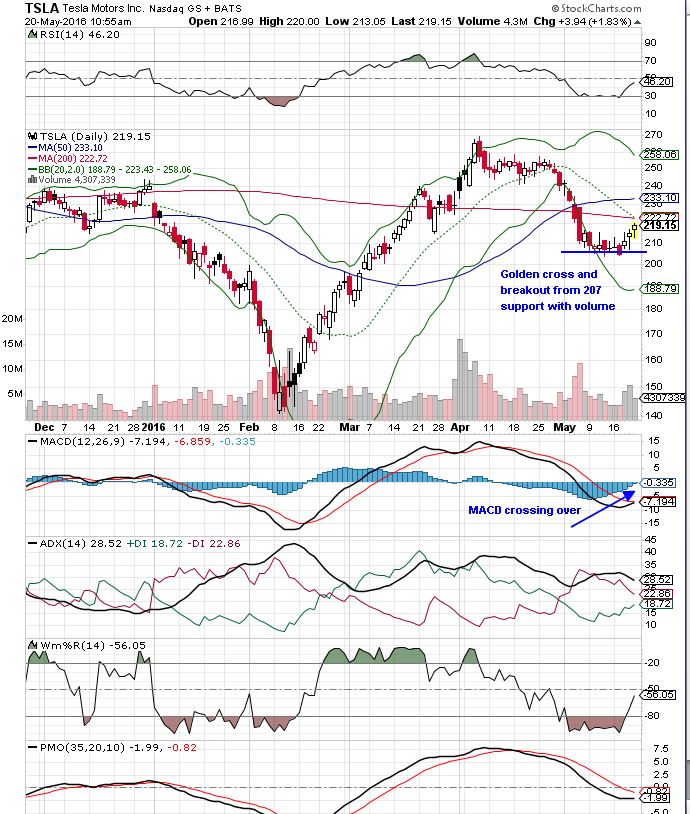
austinEV There is a lot to like in the charts technically right now. Price bounced off of the 207 support with volume. This passes my test of "its not going down anymore". Golden cross. MACD crossing over to accumulation.
 �
�
May 28, 2016
TMSE Hello chart experts,
I am a novice in charting. I think I am seeing inverse head-and-shoulder patter in the 1-yr chart, with the neck line slanting upwards. Any comments? Thanks.�
May 29, 2016
Curt Renz Indeed that is what it appears to be the unfolding situation. For confirmation the price needs to first get above the 240 level of the left shoulder, and then the 270 level of the right shoulder. Trading volume needs to heighten as those levels are surpassed. This pattern is illustrated in pages 75-77 of my book.�
May 29, 2016
AlMc Curt,
How much faith do you put in TA? Just curious as while I like to look at the charts I do not use it as the sole source of committing funds or removing said funds.�
May 29, 2016
Curt Renz Al, I also do not solely rely on technical analysis. McGraw-Hill asked me to write a primer on technical analysis, so the resulting book focused only on that. Nevertheless, I have found technical analysis to have often been helpful for finding entry and exit points, and for knowing when to stick with trends. Don't forget that price patterns must be considered in association with trading volume.�
May 29, 2016
TMSE Thanks Curt.�
Jun 1, 2016
TMSE Chart wizards,
Anything interesting in the charts? Any hope of completing the inverse head-and-shoulder pattern?
From what I see, traders on both side have suddenly lost interest in TSLA. Volume is surprisingly low for the last few days, about half the normal volume. Shareholder Meet event yesterday didn't sway.
Long term investors and long term shorts (?) could just be undecided as well. What can break this impasse? In which direction?�
Jun 1, 2016
Fallenone Err.. First of all, I don't quite think I'm seeing a revers head and shoulder pattern to begin with. The neckline, if there is one, is too sloppy. Same goes for the two shoulders.
Other stuff, we're going around 200MA, above it a few days and went below today. The monthly bar for May is a hammer which might signal reversal to upside, but the volume is quite unconvincing so I won't put too much weight on it.�
Jun 1, 2016
ggr Volume is down simply because it's memorial day week. None of the institutions trade much in short weeks.�
Jun 7, 2016
Curt Renz The Tesla share price found resistance since May 20 near its 200-day simple moving average. Today that moving average is at $221.38, and the share price moved convincingly above with heavy trading volume. It is now approaching its 50-day simple moving average at $232.32. Surpassing that would likely indicate a clear breakout.�
Jun 7, 2016
MitchJi It closed at it closed at $232.34. What does $0.02 higher indicate?�
Jun 7, 2016
Curt Renz According to Thinkorswim the TSLA 50-day simple moving average at the end of regular trading today was at $232.34, which is exactly the same as what they post as today�s regular session closing price. The $232.32 SMA that I posted earlier was what Thinkorswim was indicating at that time intraday.
In any event, the two-cent difference is immaterial. Not that it matters much, but TSLA is currently up a bit in after hours trading. What may matter far more is the move in the share price at the opening tomorrow.�
Jun 8, 2016
Curt Renz The low so far today has been $232.61 at 12:23 EDT. The 50-day simple moving average is currently at $232.46. That SMA appears to be proving it can serve as support.�
Jun 9, 2016
Svetlin Two more bounces off the 50-d SMA this morning. That has to be good, right? Would it imply that TSLA should now continue going up on technicals and momentum, or would it still need a catalyst, like Q2 numbers in July?�
Jun 9, 2016
austinEV yeah 50 day is acting like good support so far. Also, F and GM are down as much or more. Down market day. For a high beta stock TSLA is doing great.�
Jun 10, 2016
TMSE What a rough week. Bears manufactured a fake issue and successfully ran with it. It is just disgusting.�
Jun 10, 2016
geneclean55 I am a Tesla bull, but the flip side to unfortunate stories like this is the GS upgrade on same day as the secondary offering. That definitely raised a few eye-brows.�
Jul 7, 2016
austinEV Crazy how the 50 and 200 are at the same level (217) and the 20 day essentially the same at 215. If we can break out above 217.... Good stuff.�
Jul 7, 2016
TMSE Is inverse head-and-shoulder' forming? Or, is it 'cup-and-handle' formation? Does it need confirmation with move up to $260+?
 �
�
Jul 8, 2016
austinEV Both are stretches IMO. Doesn't mean it won't go up, I just don't see those patterns.�
Jul 11, 2016
drinkerofkoolaid 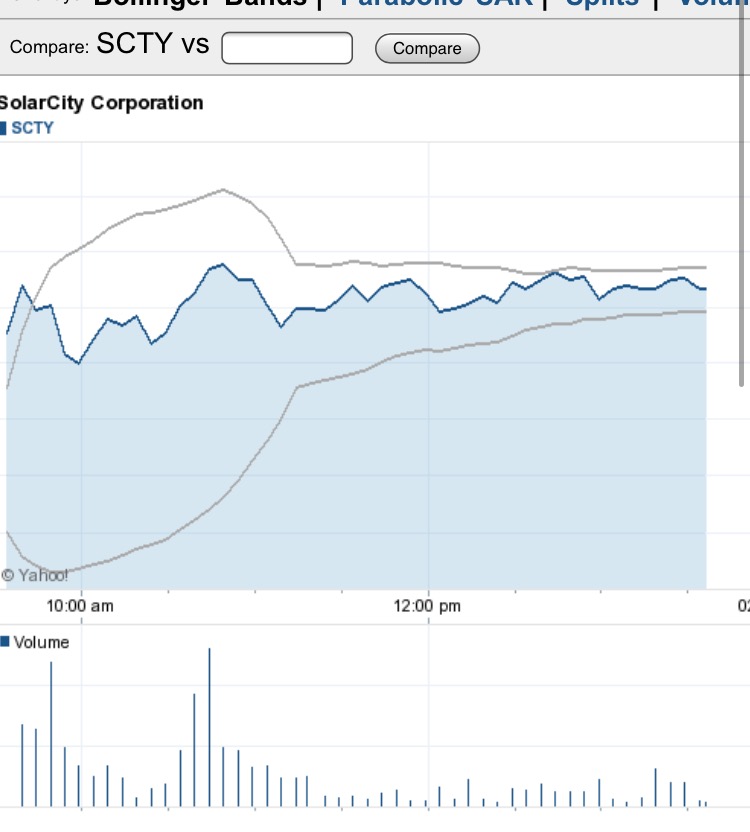
Interesting range.�
Sep 11, 2016
GoTslaGo FWIW, I'm a complete noob at Technical Analysis, so I picked up Murphy's text on Technical Analysis. In my reading he has a chart on a bullish symmetric triangle below:

When I looked at a 1 year trend on TSLA, here's what I saw (I added the lines):

I was struck by the similarities of the chart (obviously TSLA is in flux right now)!
I emailed a friend who has more knowledge, and he replied that my predicted price target for TSLA at 260 was optimistic. Whereupon I replied that I had no idea how to get a price target of 260 from the chart and asked him how he got that!? He hasn't got back yet...�
Sep 11, 2016
Novice Wonder the usefulness of charts in predicting SP movements . Do they take into consideration current events as an influencing factor ? Recently read a chart analysis by Todd Gordon of CNBC which says tesla may turn around at 210 where the two lines meet and breakthrough to a new high but apparently didn't happen . The post was end of August.�
Sep 12, 2016
GoTslaGo I'm not sure about day to day movements. From what I was reading (I haven't finished the book), the short term is really hard to predict. Lot's of variables (volume, open interest, percentage over/under the resistance/support etc...) gives clues to what is happening. I do not think they can account for sudden shifts, since much of what technicals are based on are historical movements, from what I've read.
Then there's always sudden events (e.g. SpaceX explosion) which throw a wrench into things. I suspect with SpaceX there are computer high frequency algorithms which scour the news/social media, and then make trades from it. I suspect that these are the modern "new" technical analysis with social medial trends amplified by the high frequency trades. You can see it here on TMC if you look at the "members" list, there's always bots looking through the threads. But since I'm not a bot or have a HF algo to do my work, I'm just trying to learn the basics.
The chart I found in the book was a monthly cycle (over a quarter to play out), and oddly the chart I found of TSLA was also the same (monthly), with a very similar pattern. It looks different at the end, where Dell had an up trading week which presaged a breakout. TSLA is still down toward the end, so I suspect we haven't seen down days yet. Further TSLA is still below all moving averages which is bearish and we are going into a big macro week (fed meeting, hence the down Friday). So it seems lots of stuff maybe keeping SP down for the week, but next month, who knows...
My friend who projected the 260 SP (not me, I don't know how), commented that had TSLA not announced a merger with SCTY he felt TSLA would definitely be going to 260. My reading was that if you believe in the technicals, then that uncertainty has already been baked into the price trend that we are seeing (arguably the big price drop after merger announcement in June). If he can see/project 260 from the chart, then theoretically that's where it should be going. Probably not tomorrow or next week, but later.
That being said, I'm still learning about this stuff, but find it pretty fascinating to try to discern trends from the patterns. I'm trying to see if the technicals can help me discern good entry price points, coupled with current events/announcements/macros and fundamental analysis. I am long on TSLA for full disclosure.�
Sep 12, 2016
Novice I
I'm also long tesla. Let's hope it hits 260 first week of Oct after release of q3 results�
1/1/2015
guest I always believed that charts are completely useless for stock analysis until I watched DaveT's Google hangout video with Jesse. There's a thread about it on this forum.�
Không có nhận xét nào:
Đăng nhận xét