Jul 22, 2012
richkae
Thanks Greg. Bumping this thread to remind people that we always need fresh data!�
Jul 22, 2012
Kevin Sharpe I sent my logs (VIN 272) a couple of months ago but had no response... do you normally acknowledge data submissions?�
Jul 22, 2012
richkae No, I'm horrible. I just wait for enough new data to roll in an to make it worth making some new charts.
I'll acknowledge them from now on.�
Jul 23, 2012
Kevin Sharpe glad it's not going into a black hole :smile: have lots more logs to send you and will encourage the brits to support your study�
Sep 1, 2012
hcsharp I just want to confirm that you would prefer getting the raw files. Correct?
I'm also wondering if you even want my data. More than a year old but only about 12K miles. Range mode charge gets about 246 mi. So if you're looking to study battery degradation, I don't really have any.
I'd like to suggest the possibility that capacity loss may not be related to miles so much as average level of discharge for each charging cycle. It's likely that those who drive a lot will generally be at a lower SOC when they plug in every night. Perhaps you have enough data to compare somebody who, say, drives a lot but charges at work and at home so that they rarely reach a low SOC before charging, to somebody with the same miles but only charges once a day. Maybe you can plot average level of discharge against capacity loss per mile.�
Sep 2, 2012
richkae Raw files are best.
In order to be able to compare things like depth of discharge you need more than just the last raw log file, you need a whole series of log files over the life of the car.
The raw files contain high detail records for a couple of months of data, and low detail records for many years. In order to guarantee that you have high detail for the entire life of the car you have to pull a log file every month or two.
I haven't even done that for my own car ( I've missed a few months ) but I'll try to make a chart.�
Sep 2, 2012
jory what do you mean by "raw files"?
i've been sending files sent through the VMSParser with the -b flag. do you mean that output or something else?
thanks.�
Sep 2, 2012
strider If you're ok w/ sending GPS data on where you've charged, it would be most beneficial to send the "raw" (before it's run through the parser) file. That way if upgrades are made to the parser or other data is desired they can re-run your data automatically.
Personally, I'm only sending in my VMSParser output but I'm keeping all the raw files so if need be I can re-run w/ a new version of the parser or different options. So that's an option as well.�
Sep 3, 2012
richkae The output from the VMSParser provides time your battery has spent at state of charge, charge rate and temperature. It also provides a summary of daily driving distances, the firmware history, and how long each 1000 miles of odometer took. Lastly it provides the battery self reported capacity history.
I was originally hoping to see if any of those factors affected battery capacity, but so far we just don't have enough data. The charge rate and temperature data only comes from the "short term" section of the log - and the log only keeps about 2-3 months of that data - so if you don't keep a complete history of log files ( by gathering and saving one every 2-3 months ) then that data isn't very meaningful.
If we collectively discover some factor that seems important, we can go back and add processing that data to the parser and re-run all the log files. If you stay interested in the results of this thread, then its best if you do that.
The really young cars have not been very interesting so far.
There should be a lot of 3 year old cars out there now - and over the next few months a lot more cars will be providing very interesting data.�
Sep 3, 2012
Doug_G I download my logs periodically, and I believe I have a complete record of my car's activity. If you think that might be helpful I can make the full set available.�
Sep 3, 2012
tomsax Just to be clear, we believe the log files downloaded from the car contain the GPS coordinates of every location you've ever charged at but it's encrypted.
That data used to be readable, but that portion of the log file has been encrypted since mid 2010 (firmware version 3.5.17 for v1.5 Roadsters, 4.2.34 for v2.x Roadsters). As far as I know that encryption has not been broken, and it would be easy for Tesla to make that encryption unbreakable for all practical purposes. So the odds are we'll never be able to decode that information. Even if it become possible, and there was some interesting reason I can't think of to look at that information, I trust Rich wouldn't disclose it or even decode it without first securing permission for each owner.
So, if you'd like to help us all learn more about the factors that contribute to battery longevity, please collect log files regularly and send either the summary of charge info or your whole set of log files to Rich.�
Sep 3, 2012
jory i keep all the raw log files. please let me (us) know if it becomes desirable to rerun a (new/improved/different) parser on the original files for the battery study.
thanks!�
Sep 3, 2012
brianman Do we have an intuition (or confirmation) on whether we'll be able to pull the logs wirelessly at home for Model S? Sounds like it might be worthwhile to pull the logs weekly to my house's file server. If that can be done wirelessly rather than via USB key, it's more likely I'd do it (or rather have the machines do it).�
Sep 3, 2012
tomsax In May at the Fashion Island Tesla Store Model S/X event, Ted Merendino told me that owners would be able to get some sort of log info via WiFi at home, but it wasn't clear how detailed it would be. I asked about being able to download log files like we do on the Roadster and the answer to that seemed to be "no".�
Sep 5, 2012
ChadS Thanks Rich; this is a great chart. My data is not in it because of an oddity in my log file that the parser doesn't like.
I'd be the lowest spot on the chart, though--by a wide margin after you toss out the anomaly that Rich mentions. I am at 85% capacity (166 miles in standard mode; haven't done range mode in a while, but it's barely over 200 miles) after less than 3 years and 35k miles. Tesla has done a recent bleed test and says everything seems fine...it is just a lot more degradation that I was hoping for. I can probably live with it if the degradation slows down (which all the charts say should happen)...but so far, it seems fairly linear. Too bad I have not kept good records.
I live in Seattle, and it's garaged, so it doesn't get too hot or cold. I've never raced it. I plug it in whenever it is at home. It has never sat for a long time at a low charge (or at a high charge--when I charge in range mode, I time it so I leave when it gets full). I have only gotten it in to the bottom 10% maybe 4 times (and just barely so, with one exception), and every time plugged in very shortly thereafter.
So I don't think it's anything I'm doing...I think it's just part of the variation of packs. But if anybody has any ideas for things to change, I'm all ears.�
Sep 6, 2012
bolosky It's possible that your battery has gotten badly out of balance. While it tries to balance at a full standard mode charge, I suspect that it doesn't work all that well. You should try range mode charging it and let it sit plugged in at full range mode overnight. (If you know how to get to the diagnostic screens, there's one under ESS that shows when it's balancing; leave it plugged in until it says it's not.)
I had my battery replaced with one that had been unused for a long time, and it was WAY out of balance. It took several days of sitting at full range mode charge to balance it, but it added quite a bit of mileage when it did (something like 15 miles or so in standard mode).
This might not be your problem, but if it is then it's easy to fix.
And you're not going to damage your battery by doing this once (or even a couple of times a year). You just don't want to range mode charge every day or anything.�
Sep 6, 2012
wiztecy >You should try range mode charging it and let it sit plugged in at full range mode overnight.
Talking to Tesla, unless your battery pack is really bad and out of balance (like ones sitting in storage) you get the same result letting your car sit in Std. Mode say for the weekend. Anytime the SOC is over 80% the battery will initiate its equalization process.�
Sep 7, 2012
ChadS Thanks for the idea bolosky; I tried it last night. But as wiztecy assumed, it didn't make a difference (at least, not more than a couple of miles). I got 210 miles after letting it sit in Range mode all night, just about 85%.�
Sep 7, 2012
hcsharp Chad I'm curious if your capacity loss has been linear over time. Did you lose capacity faster in the first year than in the most recent year?
edit: I re-read your post #135 and see that it has been mostly linear. Where did you see "all the charts" that suggest the degradation will slow down? I think that's true with laptops and other equipment with poor battery management, but I've never seen anything that suggests that will be the case with a Tesla pack.�
Sep 7, 2012
ChadS The one chart I remember for sure was a Nissan chart about expected degradation of the Leaf battery--this was a while back, before the Leaf was released. I remember thinking at the time that the curve looked exactly like a chart I'd previously seen of Tesla's battery, although I'm not positive where I saw the Tesla chart. It probably was on these forums somewhere, about 2 years ago. Not sure if it was official Tesla, or somebody's projection.
I've seen a third similar chart too--I am sure it was lithium, but not sure of more than that. Could have been non-auto.�
Sep 8, 2012
hcsharp All the charts I've seen were produced by battery manufacturers and were based on charging the cells up to 4.2v, and discharging to between 0 and 50% SOC. Those charts wouldn't really apply when the battery is managed differently. You probably saw something I didn't for Tesla? I've had some discussions with a lithium battery scientist who holds a couple of patents on advanced Li battery tech. It's very exciting what his company has developed already including a Li battery that will only lose about 20% of its capacity over 20+ years and more dense than what's in the 85kWh Model S. In explaining to me the difference between the next generation and current Li battery tech, he explained why I should expect my pack to degrade at a faster rate as it gets older. Not that he's necessarily right, but it made sense.�
Sep 8, 2012
JRP3 The chart I've seen for the newer Panasonic cells in the S showed a leveling off of capacity loss around 70% of original. Don't know the discharge conditions or how it applies to other cells.�
Sep 8, 2012
hcsharp I remember that too but can't seam to find it now. As I recall it only went out to about 3 - 5 years of cycling? I'm thinking of longer term. What does that graph do in 10 - 15 years? My guess based on what I know is that it would eventually turn downward again in a not-so-linear fashion.�
Sep 20, 2012
ChadS Tesla looked at my logs and say I'm out of balance. I'd already tried leaving it in full-range-mode overnight, but they say to try doing that for a few weeks?. So, here I go, out to the garage...will report back around Halloween, I guess.�
Sep 21, 2012
wiztecy Full range mode for a few weeks? That doesn't sound right... I've heard a leaving it sit after a full range mode for a few days, and that was for a Tesla battery pack that was sitting on the self for quite some time.
You can also accomplish pack balancing in Std-Mode when its above 80% SOC, but it takes longer, however its better on your pack since you're not sitting at 100% SOC doing nothing. I can see letting it sit for a "few weeks" plugged in and charged up in std. mode. Below is info I received from Telsa regarding balancing your pack. I asked what's the best way to balance the pack, std. mode or range mode charge:
"Regarding battery balancing.
Your pack will balance itself anytime it is at/above 80% SOC and has completed charge. Your pack only has the ability to balance itself just less that 1% per day. The best and quickest way to balance your battery pack is to plug it in utilizing standard charging mode and let it sit. Since you are in a R1.5 I do not have the ability to remotely pull a log file and see if/how out of balance your pack is."�
Sep 22, 2012
bolosky When I got my pack replaced with one that had been on the shelf for a long time, it took me many days (probably in the neighborhood of 5) to get it balanced again. It made a big difference in available range, that's for sure.�
Sep 22, 2012
tomsax When my pack was replaced in 2010, I did a full range mode charge and let it sit for two weeks, then a big drive, and another range mode charge and parked for over three weeks. This all had very little impact on reported capacity or pack balance (as measured by the difference between maximum and minimum brick voltage).
If you have a log file from when you did your battery replacement and balancing, I'd love to see it.�
Sep 22, 2012
strider Tom, so when you say you let it sit for 2 weeks, was it in Range mode the whole time? Was it on a charge schedule? My car is scheduled to charge at midnight for TOU pricing. I have noticed on weekends that even if I haven't driven the car it will kick in and charge at midnight and "top up". So was your car doing this every night? Topping up to a full Range mode charge?�
Sep 22, 2012
tomsax No, sitting unplugged, slowly discharging, as per advice from the Tesla service manager to get the new battery pack to balance properly.
Topping off every night in range mode would be bad. I'll bet the car would automatically pop out of range mode if an owner tried to do that.�
Sep 23, 2012
wycolo > I am at 85% capacity [ChadS]
______________________________
Roadster Battery Truth Table:
_______________________________
VIN _______690 _____ 764
MILES _____35k ______5k
BATT @ _____85% ___100%
STD CHG ___166 mi ___194 mi
_______________________________
Projected __70k = 70% = 138 mi
_________105k = 55% = 110 mi
_________140k = 40% = 82 mi
_______________________________
Assumes linear degradation (best case).
Now with ModelS, Roadster usage may
decrease significantly.
_______________________________
--�
Sep 24, 2012
ChadS While I share some of wiztecy's questions about why this type of balancing is different, it does seem to be working. On the evening of Sep 20 I charged in Range mode and got 210 miles (85%). I let it sit until yesterday morning, drove it to National Plug In Day, then charged it in Range mode again last night and got 224 miles (over 90%). Hopefully with more time sitting, it will rise a little higher--but more important, keep the capacity over a series of normal charges.�
Sep 24, 2012
bolosky This is very similar to my experience with the pack that had been on the shelf for a long time. It did in fact keep the added range, though it's slowly been decaying over the 1.5 years and 20K+ miles since then, probably due to actual cell degradation.�
Oct 19, 2012
ChadS As noted above, I had slowly degraded down to 209 miles in range mode. It sat for a few days, was driven once, then got 224 miles. Then it sat from Sep 23 until Oct 15. After a drive and another charge, it was at 219. So the first week really seemed to help; the next three weeks actually brought it down some.
I periodically looked at the voltages. Unfortunately it had sat for a full day before I first thought to look. But at first glance, vMax was 4.12 and vMin was 4.09. At the end, vMax was 4.02 and vMin was 3.99. So the difference was always small, and did not shrink (although sometimes when I checked the difference was only .02, which is supposedly the nominal delta-voltage at full standard charge. A description of balancing I got from Tesla service described one pack with a new sheet that had a very bad .2 delta). But perhaps my initial difference was actually larger, and the measurable improvement was in the first day before I thought to check. Although if the difference was made that quickly, I wonder why I didn't see more improvement when I had previously tried a range charge and let it sit over a long night. Hmm.
Well, anyway, I'm glad to be more in line with other owners now. I'll keep an eye on it and see if it stays at this level.�
Oct 19, 2012
Eberhard after 111.120km I'm down from 162Ah to 140Ah�
Oct 29, 2012
zack Pretty cool. 69450 miles, 86.4% of original capacity. That's heartwarming! 200 miles of range gets me where I need to go on one charge.�
Oct 31, 2012
dhrivnak Eberhard what do you mean by 140Ah? Nowhere on my Roadster do I see numbers like that. Where are you pulling those numbers from? I just use my ideal numbers as a capacity guide. Currently 177 ideal miles standard charge.�
Oct 31, 2012
hcsharp If you multiply the amp-hours (Ah) by the voltage you get the Watt-hours. So in Eberhard's case multiply 162Ah by 328v you get 53kWh. While Eberhard's numbers are useful, we don't know the voltage so we don't really know how much energy his battery will store at this point. I only guessed at 328v because that works out to 53kWh when his car was new.
Perhaps he's talking about energy drawn from the wall? My Roadster charges in std mode to over 400v and I almost never drive it down to 328v, making it virtually impossible for that to be his average. Perhaps Eberhard can comment more on this?�
Oct 31, 2012
donauker I would expect he was referring to the calculated ESS A-hr capacity available from the log files.�
Oct 31, 2012
strider +1. I'm at 155 w/ 2 years and 24k miles. You can use the VMSParser app w/ a -b flag against your log file to get the Average brick A-hr.�
Oct 31, 2012
tomsax Using VMSParser, the -b option dumps out a bunch of stuff from multiple log files to send to RichKae for his battery study. If you just want to get the Ah history of your car, I recommend:
VMSParser -p -r DAY <logfile>
That will show your average and minimum brick Ah every day typically back to when the car was built. If you want to load that data into a spreadsheet, add the -t option to get tab-delimited text.
For more info: VMS Log Parser for Tesla Roadster�
Nov 9, 2012
lmore I earlier reported that the OVMS reports that the battery is warmer than the ambient temperature, usually 6-10 degrees C warmer (ambient temperature now is around 0 C). No problem has been found with the battery, Tesla Motors checked the log files and I got help here as well. Now I noticed that when I reach a quite low level of charge (below 30 %) and park the car without it being charged, the battery level drops real fast while the car is being parked. Yesterday night 22:00 the OVMS reported 28 %, 23:00 it reported 27 % and this morning it has dropped to 17 %. Now it has been stable on 17 % for two hours. It is not the first time I've seen this. Anyone experienced similar behavior?
I have not driven or charged the Roadster much the last weeks, only drive a few km each day and haven't fully charged it, perhaps that causes the battery pack not to be balanced?�
Jan 17, 2013
Timothy I just came across this thread tonight. Being a non-techy biology type, you guys are speaking a different language than I do. Anyhow, I just had my annual service at Tesla Menlo and asked them about the battery as I had noted the ideal standard charge had dropped from 184 to 176 since I bought the car.
I was told the best way to evaluate the battery is with the CAC (Calculated Amperage Capacity?) New cars are supposed to have 16 (who knows what units?) My car was manufactured 12/2010 and I bought it new 5/2011. At the car's service 12/2011 the CAC was 153. At the recent service 12/12 it was 147. I was told the 8% drop in 2 years since manufacture was 'normal.'
I drove from Menlo after the service to Santa Barbara (300 miles) and had about 25 ideal miles left on standard mode when I arrived. I charged in range mode--217 ideal miles--and unplugged the car and let it sit for a week to balance the battery. No change in the standard charge since. 175 ideal miles tonight after the standard charge completed.
So can any of you explain if this is a good way to evaluate the battery--and what it all means?�
Jan 18, 2013
JRP3 For one the car needs to be plugged in to balance the battery. The BMS needs to bleed charge off the higher voltage cells while charging the lower voltage cells to bring them up. 8% drop in two years does sound fairly normal, maybe a bit on the high side.�
Jan 18, 2013
wiztecy I heard the opposite from Tesla. The car does not need to be plugged in to balance, but rather needs to be above 80% to kick off the balancing procedure. I verified this is true. Also I heard that in order to calibrate and bring up all the sheets to calibrate you have to drove on "one key turn" from above 80% SOC down to 30% SOC. If you turn the key off at any time the calibration will not occur.
As for the drop in range, I'd suggest seeing if you have a consistent lowest brick and possibly a sheet that's "lower" than the rest. You can run the "VMSparser -b" option
as well as the "DAY" option as Tom indicated a few threads up. If you see the same brick or the same set of bricks in a sheet always having the lowest Ah capacity that's most likely your issue. As for having Tesla fix that, that's another question. I don't know if 8% drop is for across the whole pack is normal or if 8% drop due to one bad sheet is also normal. I would say the latter should not be considered normal really.�
Jan 18, 2013
JRP3 What mechanism is used to balance the pack when it's not plugged in?�
Jan 18, 2013
tomsax I'd like to encourage everyone to participate in a survey I'm conducting for Plug In America to help Roadster owners better understand what to expect for battery capacity over time and to better understand what "normal" is. Plug In America Tesla Roadster Survey
I've just added a question about CAC, so hopefully we can shed some light on how CAC changes over time and miles and also see how it correlates with ideal range after full standard and range mode charges.
Regarding extracting battery history from log files, in VMSParser, the -b option is for summarizing a bunch of the detailed data from many log files to participate in Rich's battery study (the topic of this thread). If you just want to look at the average and minimum brick amp-hours, you just need to run VMSParser on your most recent log file and use -pr DAY to dump out all of the daily records. It is believed that the brick average amp hours is the same as, or similar to, the CAC value.
Finally, I believe there are two types of battery pack balancing: during charging and after charging. After getting my battery pack replaced, I was told to do a full range mode charge and let the car sit for 2 or 3 weeks to let the modules balance. (I'm dubious that this does much, but I'm not a Tesla service tech.) I think there's also some module balancing that happens at the end of charging, at least sometimes.�
Jan 18, 2013
hcsharp It's true that CAC is a better measure of real capacity than post-charge ideal miles. It's also true that ideal miles displayed after charging has settled (10 min to 1 hr later) is usually fairly close (proportionally) to CAC. So if your car has gone from 184 ideal std miles when new to 176, then you've only lost about 5% which is good. I don't have the data that Tom Sax and Rich have but I've heard of new Roadsters with as much as 162 CAC and as low as 158. If you started with 160 CAC then you have lost 8%, but it's more likely that you started with about 157 or so if your car had 184 std mi when new, and 153 at the first annual. Personally I don't think you're losing range any faster than anybody else, but I wonder what Tesla did with your car for 5 months and what the CAC was when manufactured (12/2010). Keep in mind this is my .02 and probably worth about that much.
Based on my own experience, it will balance at the end of a charge whether plugged in or not, but there may be differences in how it's done. It doesn't sound like your (Timothy's) pack is out of balance. Sometimes it will recalculate the CAC without going below 30% SOC, and it doesn't have to be a one-key-turn session based on my own observations with my 2.5. Again, I'm not a Tesla engineer.
Like wiztecy said, I would recommend you pull your log file and have somebody look at it with the parser. I'm sure there's plenty of people who can do this in your So Cal owners' group or Green Speed. I'm curious what it reveals. Please post it here if you find out anything.�
Jan 18, 2013
tomsax The car is always using power, especially at the top of a range mode charge when it keeps running the coolant pump and possibly the fans. It could be selectively drawing power from high-voltage bricks. I don't know enough to confirm that, but I know multiple owners who have been told to do a full range mode charge then let it sit for weeks to balance the pack.�
Jan 18, 2013
smorgasbord I highly recommend keeping the car plugged in whenever it's at full Range mode charge. That way the car won't hesitate to keep that battery as cool as possible. You don't want the car to sit at Range mode full and let the battery get warm.�
Jan 18, 2013
stopcrazypp From the description it's pretty clear it's pretty much discharge only (I don't expect regen to do much). You have to reach a relatively low 30% SOC and I presume that is low enough that you don't have to bring up the lower voltage cells.�
Jan 18, 2013
wiztecy Tesla's proprietary algorithm. My pack balances out within 10-15 mins typically no matter if I leave the charge socket plugged live in or have it disconnected. Tesla indicated to me this balancing algorithm gets fired off anytime the SOC is equal to or above 80% SOC and I have verified that. It is able to balance an "out of balance" pack faster when charged 100% range mode and I'm sure the Algorithm has to work harder and run longer to calculate and manage each brick and each sheets total capacity the closer the SOC is to 80.
As smorgasbord pointed out, I also agree that if plugged the thermal management has the opportunity to run if temps are reaching a critical temp. I don't need it in Santa Cruz but if you're in Vegas or Arizona I could see the benefit. But again I've never seen my pack temps rise just sitting there after it finished executing a charge cycle. The cooling system already managed what needed to be done where you'd have more control monitoring it yourself and re-executing a low amp charge cycle to bring the temps down again if needed.
As for the one-key / below 30% SOC advice I was given by the Tesla Service Manager, I tried it, didn't see any effect in my total CAC, it stayed the same. My pack is has always been a well balanced pack. I let it sit at 50%-60% SOC if its not going to be driven and when I do need to go out on a +30mile trip I do a full Std. mode charge then allow it to take 10-20 mins if needed to balance. Have all 0's in my balance grid, always have.
I have 148.6 to 149.8 Ah average capacity, charge to 181-182 Miles in Std. Mode and 232 miles in Range Mode. 14k on the clock.
Has anyone seen their Ah capacity rise, and if so what/how did it occur? Hotter Summer temps vs. Winter? Does cold diminish the Ah capacity?�
Jan 18, 2013
JRP3 There seems as if there are two different suggestions, one is to charge the car and then let it sit, the other is to discharge it fairly deeply.
An algorithm is an instruction set, not a mechanism. As far as I know there are two ways to balance, top or bottom. Top balance, which I assume Tesla uses, requires charge to be bled off of the highest voltage cells while lower voltage cells are kept charging to bring them up. This either happens while charging with resistors bleeding charge or it could happen by shuttling charge from higher voltage cells to lower voltage cells, which could happen even when not charging. Bottom balancing does the opposite, during a deep discharge it will balance all the cells so that they all hit the same voltage when near empty. That's how I manually balance my pack. Since top and bottom balancing are mutually exclusive I don't see how the one-key below 30% SOC makes any sense since I assume Tesla uses top balancing.�
Jan 18, 2013
dhrivnak I believe Tesla only top balances. So your batteries have to be above 80% for the voltage differences to show up to balance. You can balance faster with a range mode as it can more easily detect voltage differences.
Then I think the reason you occasionally want to do a deep discharge is so the software can better detect empty and full. If you only drive 10 miles a day and thus cycle your pack between 75% and 80% the software can loose track of the full range. Going to the bottom and top allows it to recalibrate.
Finally I have found I can vary my range (STD miles) by nearly 10 miles if I want. If I charge with 110V and check just after a charge it can be 183 miles. If I charge at 240V 30 amps at 4 am then when I leave for work at 7:30 I can have 178. If I charge say at 11 pm then my mileage may be down to 176 in the morning. If I charge at higher currents I can be in the low 170's. At one point I thought my mileage had dropped but most of the drop was chancing my charge time from 2 am to 11 pm.
So the time and rate of charge does have measurable effects.�
Jan 18, 2013
wiztecy From the behavior of my Std. Mode charge, it appears Tesla may use Top balancing? I don't know if this is seen across all Roadsters, a few, or mine. But now that you mentioned it... I tried three experiments to try and bring up my Ah capacity in sheet 4, its my weakest sheet with all the bricks lower than all the rest of the bricks in the pack. I think something went astray there.... After talking to Tesla about watching my range drop from 188 to 182 they suggested to swap out the BMB in sheet 4. I haven't seen it drop any further than 181/182, so possibly they addressed the degradation? I really don't know. At that time sheet 4's bricks were all around 148-149 Ah. The other sheets bricks were around 153, mostly at 155, and a few at 157 Ah. So in my experiment to recover sheet 4 I tried a couple of things:
Note that when I would charge in Std. Mode, the Pack would charge to 194 miles and then settle in at 182. This was seen before and a little after the BMB swap. 182 is 84% SOC for me.
1) Did a full Range mode charge after I was discharged down to 30%, multiple key turns. Pack charged up to 249 Miles then settled down to 232 miles. I allowed the pack to sit there bleeding off the charge for 3 days where the pack came down to 191 miles when put into Std Mode. I don't recall the range mode number.
-On my next Std mode charge, no change in std mode miles.
2) Did a slow 220V @ 12Amp charge from 30% to a full std. mode charge. Pack charged all the way to 212 ideal miles, and then after balancing came down to 183.
-Gained 1-2 miles and no significant Ah's, but only for that single charge. Multiple key turns. (Balancing took 20-30mins)
3) Did a 220V @ 30Amps, charged from 30% to full std mode. One single key turn from the previous full std. mode charge to 30% SOC. Pack charged up to 213 Ideal miles and then settled back in at 182 after balancing was completed (20-30mins). What is interesting is that I see the charger taking the pack all the way up to (213 miles) 94% SOC right when it shut off in Std. Mode. -No miles / Ah gained.
Possibly this high SOC is part of the Top balancing behavior you were describing to bleed off the voltages off the stronger cells while trying to bring up the weaker ones. I kicked something in/on with experiment 2 and three above but it didn't yield any positive results. Will see if my next few Std. Mode charges will be taken as high.
From talking to the Tesla Service Manager, I think when he described driving the SOC down to 30% this possibly could be Bottom balancing?
I know he mentioned two distinct balancing methods that occur, the one where it has to start charging below 30% SOC ( and would be nice to know if that single key turn theory is correct or not ) and the one above 80%.
Thanks for the clarification. Always intrigued, wanting to know more.�
Jan 18, 2013
JRP3 Dhrivnak may be correct that the deeper discharge is helpful for the car to calculate actual ah capacity of the cells and/or better calibrate the range gauge. I can't imagine using both top and bottom balancing since they would be in conflict.�
Jan 18, 2013
wiztecy Forgot one other experiment, #4 where I drove the SOC down to 9% SOC and then did a full range mode charge. No change in range. I have heard others who did get 5-8 miles back that way. Possibly people who's packs were out of balance in the 1st place unlike mine.
Wish Tesla could give an accredited run down of all these charging behaviors, to distinguish what's real and what's a myth.�
Jan 18, 2013
hcsharp That's correct - it top balances and uses a deep discharge to recalibrate capacity. On my 2.5 it won't recalibrate after short trips (down to 70%+- SOC?) but it will recalculate your CAC (calculated A-hr capacity) if you go much lower than that. If you go down below 30% it does a better job.
The battery design and management is very sophisticated. The cells can be connected electronically in both series and parallel (not at the same time of course). They charge and discharge in series. From what I can tell there are 69 strings of 99 cells per string. When discharging, the 99 cells in a string are connected in series. Each of these strings is connected in parallel with the other strings. With 69 strings it's easier to manage the high currents involved.
When balancing, it connects the 69 cells in each brick in parallel to balance within the brick. Then the electronics monitor each brick and bleed them off until they accomplish two goals. First goal is to get them reasonably well balanced. But they also make some adjustments so that the lowest A-hr brick doesn't stay that way. Bleeding some bricks off more than others helps prevent failure runaway that would happen as soon as one brick lost one or two cells, taxing the remaining cells in the brick that much harder, causing that brick to fail sooner than the rest. Ultimately this will happen anyway, but this type of management slows the degradation way down.
Anybody who thinks the Roadster is just a giant battery with a fancy speed control and motor is very mistaken. It's a very sophisticated system and engineering accomplishment.�
Jan 18, 2013
wiztecy This is interesting, my Roadster doesn't lose that many miles sitting overnight, even when temps drop from 70 down to 30 overnight. If I charge to 182, at most I'll loose 1-2 miles overnight. It doesn't consume that many miles sitting idle. I may try a 110V charge one day to see if I can get my miles past 182/183. With my experiments, charging at [email�protected] vs 30amps had very little effect. It appears others are seeing larger spreads like yours. I'm also curious if there's a relation with this spread and also if the how well the battery pack is doing balanced-wise.�
Jan 19, 2013
JRP3 This puzzles me. To do so the pack would have to physically disconnect all the high current series connections. If there are 69 strings that's 69 high current connections that have to be broken with large contactors, and then another set of connections in parallel have to be made, though at lower current levels for balancing. When the series connections are open pack voltage would drop to the level of a single string and the car could not be driven. I would think it more likely that Tesla simply bleeds off charge with resistors, or uses charge shuttling from high to low strings.�
Jan 19, 2013
dhrivnak I do not think I lose more than 3 miles/day in "vampire load". Most of the other variation comes from different charging rates. Try charging at 120V and I suspect you will see a boost in range of a few miles. We are talking about 5% of the capacity so they are not large effects.�
Jan 19, 2013
wycolo TOP OFF - No one has mentioned this function lately, so I guess it offers no particular help wrt balancing. Likewise, no particular help wrt making a long-distance trip; if you *really* need that extra 6-8 miles you'd be better off doing a partial RANGE charge for 20 extra miles. So T.O. is mainly for initiating recharging for a Roadster that sits plugged in & idle for weeks at a time, to avoid the need to unplug/plug back in? [ModelS has been hogging the outlet for weeks now; must buy Roadster its own extension!].
--�
Jan 19, 2013
Doug_G Top Off seems to only be useful if you do a Range Mode charge and leave the car sitting for a while. I don't tend to do that.�
Jan 20, 2013
hcsharp You misunderstood the design. Breaking the load up into 69 strings is what makes it easy to manage, eliminating the need for contactors. At full power 215kW you have less than 10A per string which is easily switched with electronics. Another advantage of this is that if one cell fails or becomes weak you can disconnect the whole string that it's in with little impact on the operation of the car. This reduces uneven stress on the other cells in the pack, helping prevent what would otherwise be a faster decline of the first few bricks that develop weak or dead cells.�
Jan 21, 2013
JRP3 69 strings in series passing only 10 amps?�
Jan 22, 2013
hcsharp Not even 10 amps. Why would you think it would have more? The strings are not in series with each other. Read my post again and you'll see that the strings are connected in parallel with each other and the cells in each string are in series.�
Jan 22, 2013
JRP3 So 99 cells in series x 3.7V = 366.3V at 2.2ah. 2.2 ah x 69 = 151.8 ah x 366.3V = 55.604 kWh. But to get 225kW, 225,000 watts, of power with 366V means pulling 615 amps.
366V x 615 A = 225,090 Watts, 225 kW. �
�
Jan 22, 2013
drees It's 99 cells in series, 69 strings in parallel.
615A/69 = ~9A per 99 cell string.�
Jan 22, 2013
tomsax The Roadster battery pack consists of 11 sheets. Each sheet has 9 bricks. Each brick has 69 cells in parallel, so each brick voltage is around 4V when charged. The bricks in each sheet are in series, so each sheet produces about 9 * 4 = 36V. The sheets are also in series for a pack voltage around 11 * 36 = 396V nominal.
My understanding is that the cells in each brick are soldered together in parallel and can't be individually addressed. Doing that would require 2x6,831=13,663 transistors capable of 10 amps each. It seems like that would be pretty expensive.�
Jan 22, 2013
hcsharp That was my understanding for a long time as well. Then recently I was told differently by a Tesla engineer (not a technician). The discussion was the result of questions that I had about what happens when the first cell goes bad in one of the bricks. My concern was that it would cause that brick to wear out significantly faster than the others. In a battery that is only as strong as it's weakest brick, and the weakest brick is getting stressed more than all the others, your whole pack will become useless while most of the cells are still in good condition. That's when I was told that one bad brick cannot be isolated when under power because it's almost impossible to shunt nearly 600 amps. Instead it's designed so one bad cell will not stress any remaining cells more than any others.
I also think this design only requires 6,831 transistors that can handle 500ma or less, in addition to 69 that can handle 10A, which would be inexpensive.
I have not taken a battery apart to verify any of this. But you don't have to think about it very long to realize it makes a lot of sense. If you have evidence that this is wrong, please correct me.�
Jan 22, 2013
tomsax How is that? The 69 bricks are in series, so each one has to produce about 600A at 36V. The voltages add up to ~400V, but the current through each brick has to be the same.
Because the cells are in parallel in each brick, they have to average 600/69 = 8.7A. You're right that you only need one transistor per cell, but it seems like each one has to be able to handle more than 8.7A.
How do you get 500mA?�
Jan 22, 2013
hcsharp If you assume that the cells are permanently hard wired in parallel in each brick, then you are correct. On the other hand if a string of 99 cells are permanently wired in series, one cell from each brick, then you only need one small transistor per cell to connect it in parallel to the other cells in the same brick. I guessed at 500ma but that is probably overkill. If the cells in a brick are in a parallel state most of the time then there would never be much current flowing between them. The transistors would mostly be used to disconnect or isolate a string.�
Jan 24, 2013
richkae Here are some charts with all the latest data.
I parsed all the data and some of the log files do not start when the vehicle was new, so the time span is bogus.
It's also clear that any vehicle that doesn't start with 158 or 159 amp hours has a log file that doesn't have data all the way back to new.
Max = the maximum weakest brick amp hour value ( brickahmin ) found in the file
Min = the minimum weakest brick amp hour value ( brickahmin ) found
Last = the last weakest brick amp hour value ( brickahmin ) found
( Thus a vehicle that was very out of balance but then rebalanced will have a last value higher than the min value )
First, amp hour data plotted against the odometer ( miles ).
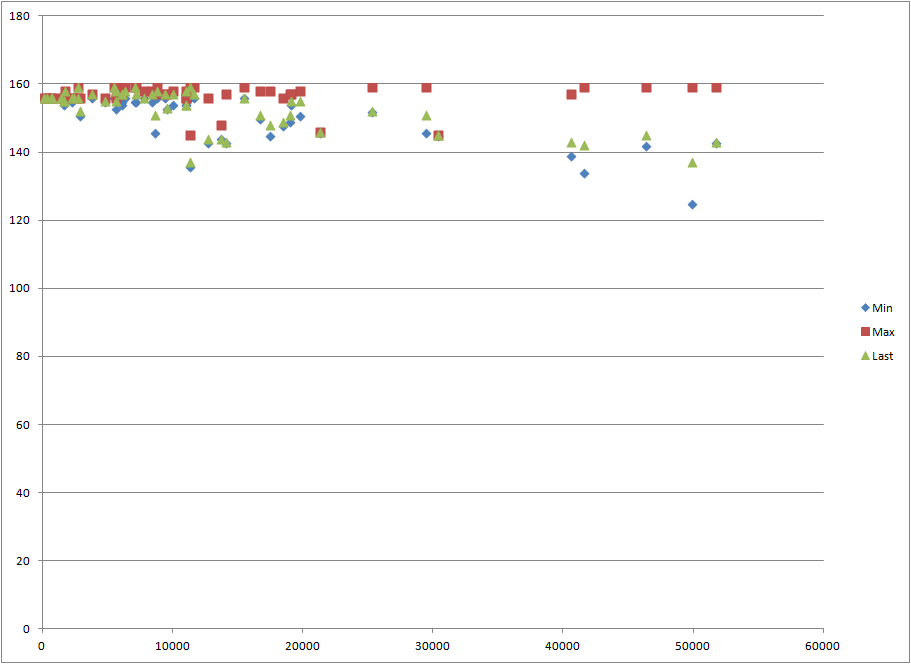
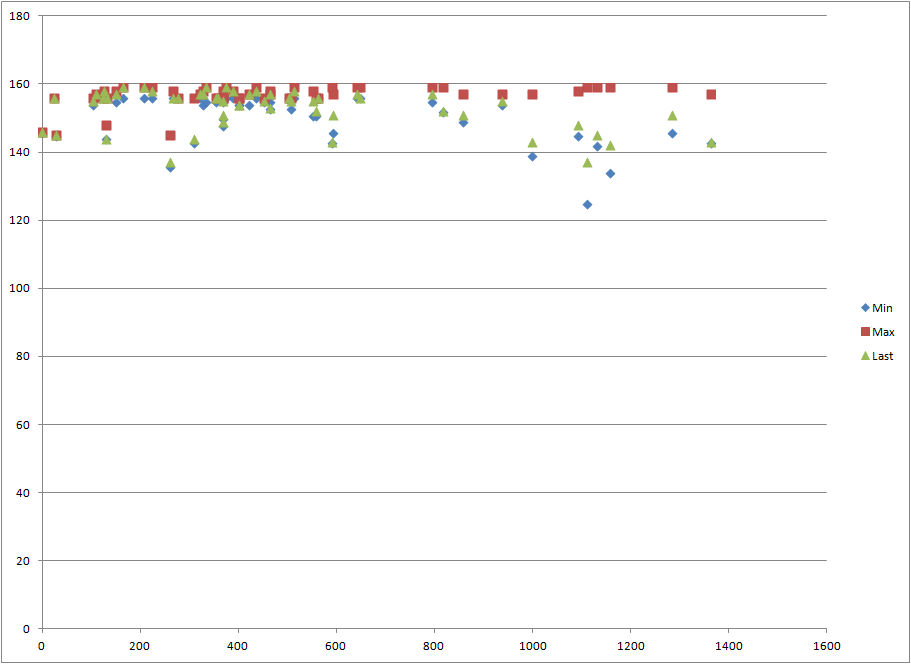
Second, the amp hour data plotted against the number of days spanned by the log.
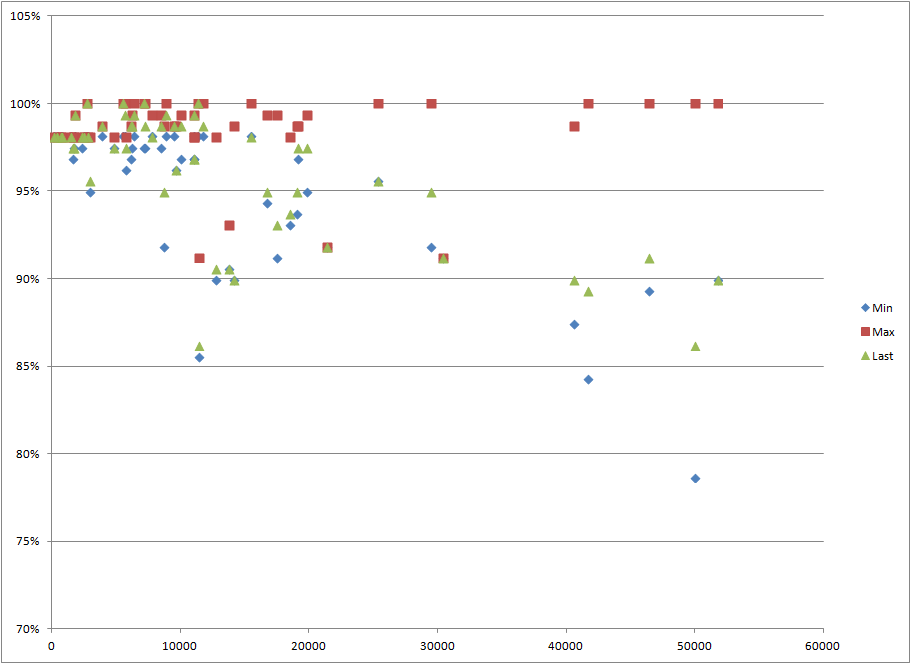
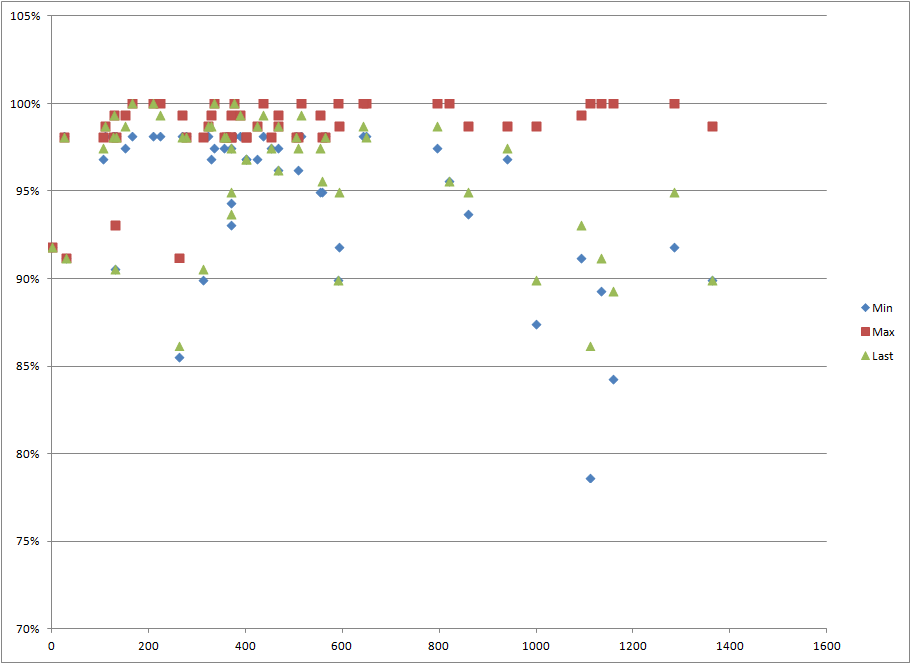
Then the same data in percentage form. The percentage is computed assuming 159 amp hours is 100%.
 �
�
Jan 24, 2013
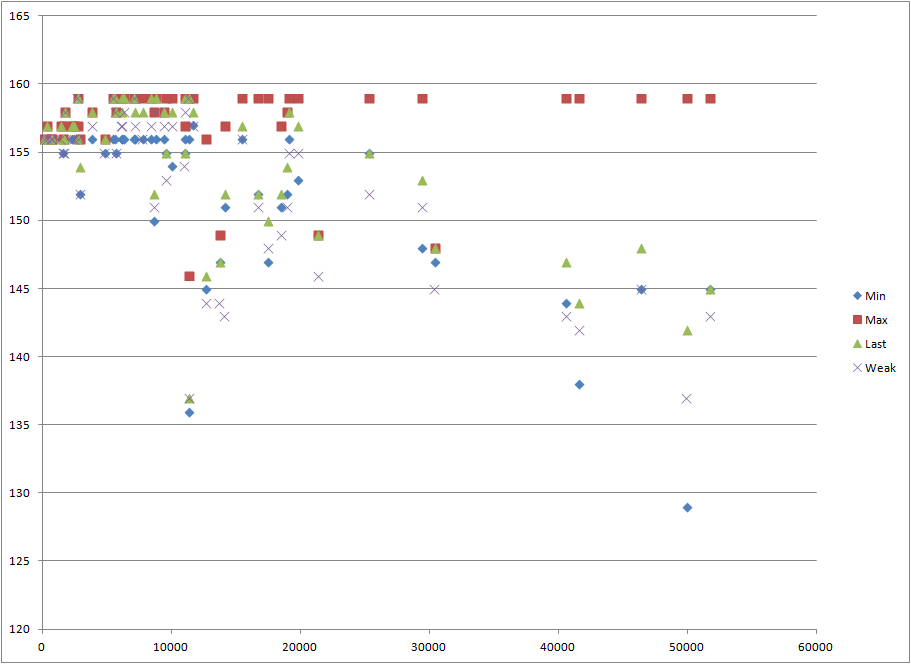
richkae Here is a new ( better?) chart.
Min = minimum average brick amp hours ( brickahave )
Max = maximum average brick amp hours ( brickahave )
Last = last average brick amp hours ( brickahave )
Weak = last weak brick amp hours ( brickahmin )
 �
�
Jan 25, 2013
brianman @richkae - Are you able to make any "quick" observations and/or guesses about the "min" cases w/r/t usage whether there are charging and/or consumption patterns in common across them? Or is the data too noisy, or do you think it's just variation in quality of the battery packs delivered?�
Jan 25, 2013
richkae No observations or guesses at this time.
We only have data for 5 really high mileage battery packs.
Unfortunately there isn't a lot of good detailed data, maybe Tom's Plug in America survey can provide some guidance as to what to look for, then we rev the vmsparser and try to gather it from the log files.�
Jan 25, 2013
markwj Btw, I've also provided Tom with a large set of anonymized data from OVMS charge records. I hope it is of some use to narrow down the criteria affecting long-term capacity.�
Jan 29, 2013
richkae Here are a couple of interesting charts.
The first is % battery loss per 10K miles, charted are the 17 vehicles with at least 14K miles.
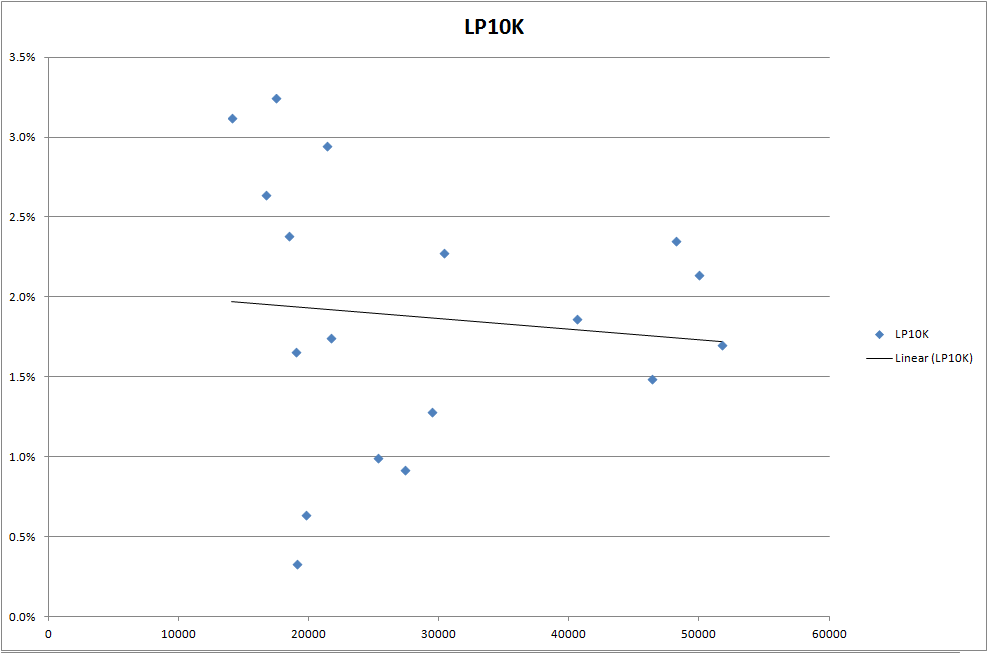
The line shows that you can expect about 1.75% loss per 10K miles ... if you look on the right at the high mileage cars, the low mileage cars are highly variable.
This one is %battery loss per 10K miles on the horizontal axis.
The stacked charts are % time at different SOC levels. ( The vertical axis is time - totaling 100% not SOC )
T0-15 means time at SOC between 0% and 15% inclusive.
T91-100 means time at SOC between 91% and 100% inclusive.
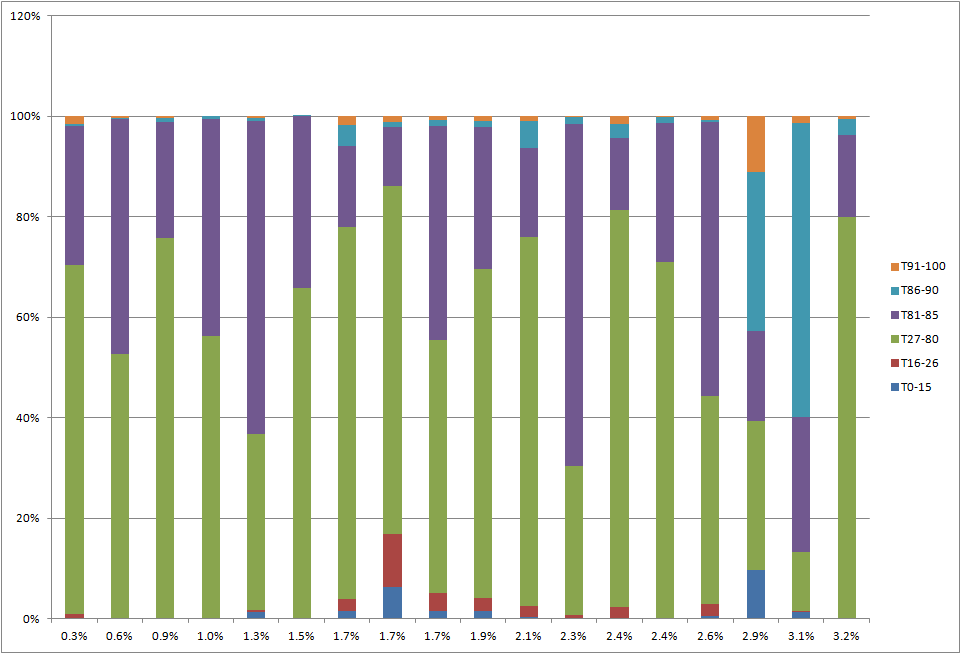
The vehicles that spend a lot of time >= 86% SOC or below 15% SOC tend to be on the right ( higher %battery loss per 10K miles )
It is consistent with the rule of thumb: don't leave your battery full or empty for long periods of time.
Major caveat: I need to do a bunch of work to verify this data. It might be from a very small sample of the vehicles life and thus not very reliable.
Final note: I defined % battery loss as the % drop of the last "brick ah ave" number in the log file from 159.�
Jan 29, 2013
brianman I really like the second chart. It's hard to tell directly but I'm curious about the middle bands.
More specifically...
1. Exclude T0-15, T16-26, T86-90, and T91-100 (which leaves the two middles: light green and purple).
2. Collect all the green bar heights.
3. Collect all the purple bar heights.
4. Plot green and purple as independent curves, and rescale them so that the total "points" for each curve is matched (i.e. divide each bar height by the total of the bar heights for that color).
I think this would show the percentage within the green and purple bands of each battery loss notch.
I'm curious if the green or purple shows more to the left vs. the right.
I may try eyeballing the numbers on my end to see if I can build the plot myself as well.�
Jan 31, 2013
hcsharp Thanks again for compiling and posting this data. Interesting indeed. But when I saw your final note, I had to wonder how accurate it is. You assumed all the cars started at 159 Ah. I don't have the data you do but just from informal conversations with other owners I know there is a variance in the Ah when new of about 4 (158 to 162). Maybe you can confirm this with the data you've collected. So if my car started at 158 Ah when new and dropped to 157 at 10K, it would appear on your chart as having lost 1.26% even though it actually only lost half that much - 0.63%. That might also explain why the data points converge on the high mileage cars. How much variance have you seen in the logs for Ah when new?�
Jan 31, 2013
richkae If you look at the x,y plots I posted on 1/24 all of the log file data has a maximum Ah value of 159. Most of the log files show a max value between 156 and 159, none of the ones I have are higher than 159.
That is almost all the data I have ( data from 2 or 3 new vehicles has come in since 1/24 and I haven't made a new plot ) and you can see the full range of values there.
In lots of the log files the first values are not the max values ( they go up 1 or 2 points before declining ) and there is a lot of variation after firmware upgrades.
I assume that any log file I have where the max value is less than 156 is probably incomplete, and is missing some data from the early life of the vehicle.
But you are right, assuming that every vehicle started at 159 is probably not a good assumption.�
Jan 31, 2013
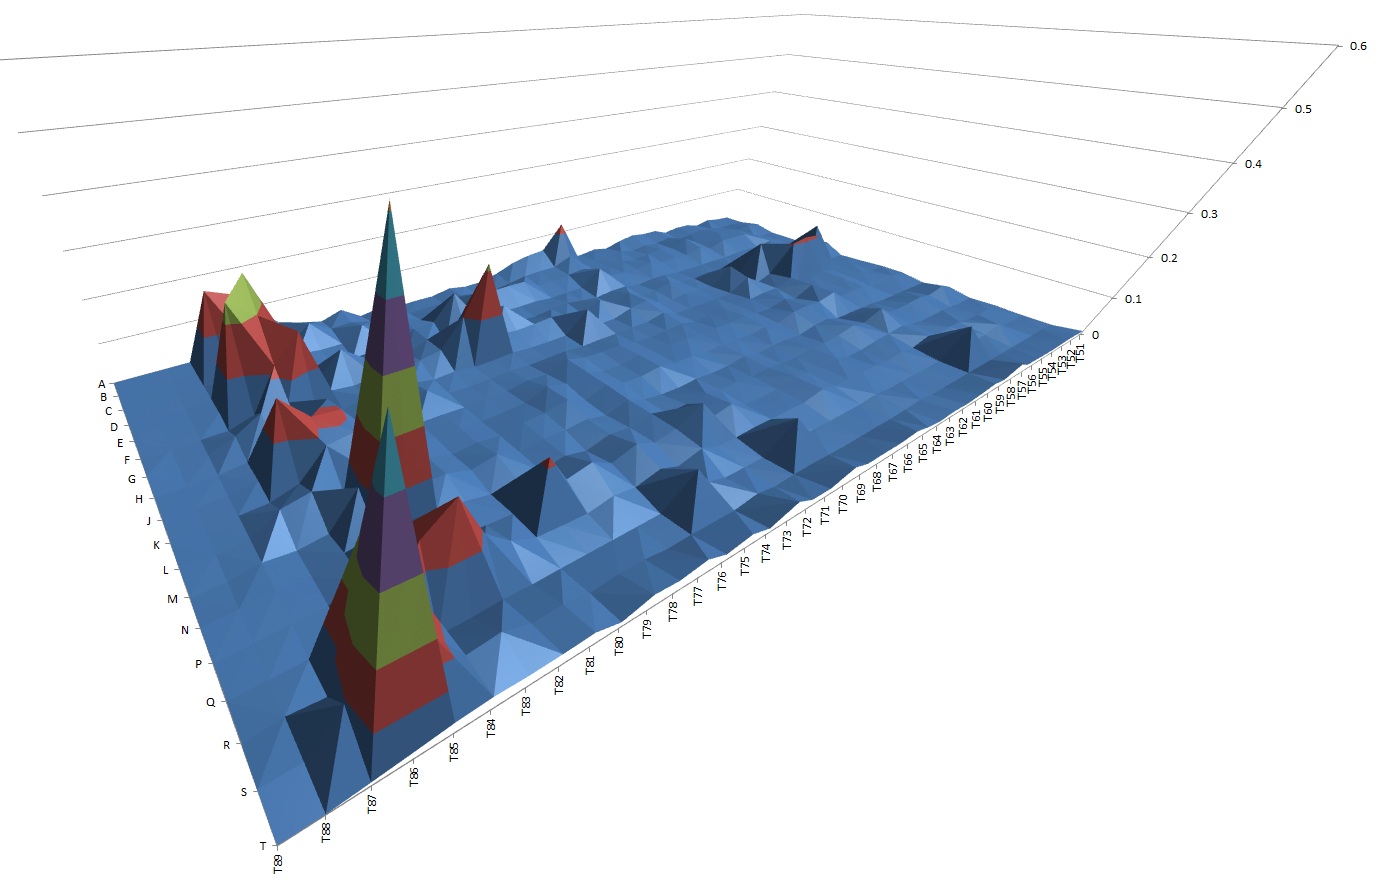
brianman Rich was kind enough to share his data, so I was fiddling with Excel graphing to see if I could notice anything interesting.
Discarding the data from [0%,50%] and [90%,100%] SOC allows me to zoom in on -- what I think is -- the interesting part of the graph. Here is a surface plot with the left axis being vehicles (A through T) and the right axis being time spent at version charge levels (from 51% to 89% SOC). Vehicle A has the least loss, while vehicle T has the most loss (ordered by the LP10K column, Rich, as you had it in the data).
I'm having trouble reading much definitive into the data. Nonetheless, what I think I see in the visualization is:
1. Spending much time at high charge (86-87%) decays range most.
2. Spending little time at medium high charge (85%) decays range second most.
3. Thus, the sweet spot is to spend a "reasonable" amount of time at medium high charge (85%).
#2 (and thus #3) might be explained in that doing so allows the pack the opportunity to rebalance
Note that the plot for (I think) M shoots a hole in #2 and #3 assertions, but the rest of the data seems to align with what I've described. Edit: Actually maybe it doesn't, that spike is around 80-81% SOC -- perhaps below the sweet spot where rebalancing has a chance to do its magic.
Here's the chart:
 �
�
Feb 14, 2013
user497 Hi all, I just sent Rich my latest logs. I have 15k miles on my roadster but I haven't been able to drive it that much recently. Since I only drive about 20 miles per day, I have mostly been charging with the 110V but I did drain the car down pretty low and then recharged it in range mode a couple times in mid-Nov. Currently when I charge in standard mode I only get 155 miles (note that it has been low for over a year now so I don't think this is just due to cold whether). My brickahmin/brickahave is 145/145. In fact my min/ave has always either been the same or off by 1 (which I think is a good thing because if you had a bad brick I would assume that the min would be much lower than the average - or that means all of the bricks are bad). However, 145 is on the low end of Rich's graph from his posting on 1/24. I am asking Tesla again to figure out what is going on but in the past they have told me that the battery is fine and that the range is just showing low because I drive sure short commutes and then recharge with a 110V and that the battery would really let me drive further. I guess one way to confirm that would be to drive until the battery runs out (maybe I can circle around a parking lot in Milford until I run out?) but I don't want to void my warranty�
Feb 15, 2013
strider You are correct in that if the average and min bricks are the same or close you don't have an unbalanced pack. Do you have the time to drive it to a low state of charge, do a range charge, and then drive it for a bit? That should recalibrate the gauge.
Also, running your car out of juice to shutdown will not void your warranty unless you fail to plug it in soon after doing so. A few members here have done so in the past.�
Mar 7, 2013
smorgasbord The Plug-in American survey thread indicates that CAC is 160 when new.
I find it interesting that Rickae tried correlating capacity with time spent at certain charge levels, and then brianman tried correlating capacity with time spent at different charging levels.
I'd be interested in seeing capacity versus time spent at different temperatures, with charge level being a second factor.
We know that Range mode, which charges the battery the most, goes to great pains to keep the cells cool. When a Range charge is done and the car stays plugged in, you'll find the car's AC system remains engaged to keep the cells cool. I'm speculating that these two factors, temperature and SOC, have the strongest correlation to degradation.
I just sent my data to Rickae.�
Mar 7, 2013
JRP3 Sure, both high voltage and high temperatures affect electrolyte breakdown.�
Mar 7, 2013
hcsharp You mean after mileage? Because mileage appears to be the biggest factor so far.�
Mar 7, 2013
richkae I had hopes to do lots of analysis of temperature vs battery longevity.
There are 2 data streams in the log files, a "permanent" section with daily data, and a "short term" section with high resolution data. The high resolution data is only a couple months worth.
The high resolution data is where the temperature information is.
If you pull a log file from your Roadster every 2 months or so, then you would have all the high resolution data without loss.
The code I wrote in VMSParser to spit out temperature data needs to correct somehow for the partial sampling to be useful. You'd need to track the time window and how that would extrapolate out to the whole year. You cant compare a log file with summer data to one with winter data.
The VMSParser will process all the log files you have and put the data together, so you might have multiple data segments with voids inbetween, which makes the extrapolation a little more complex. ( it doesnt reprocess the same events - or shouldnt ).�
Mar 17, 2013
driver_EV I submitted the logs I have for my Roadster.
Played some with the Parser. I imagine an issue with weakness in the ESS might be identified with one or more bricks.
When I poked around with the log I pulled shortly after my car was delivered It seemed I could see more information with voltages and/or SOC than I see now, unless I am doing it wrong now. I just performed a full range charge from ~10% charge and the car seemed to perform balancing after that finished (for 1/2 hour or so). I was hoping to be able to see brick voltage samples before and during the charge, and see what changed at balancing stage.
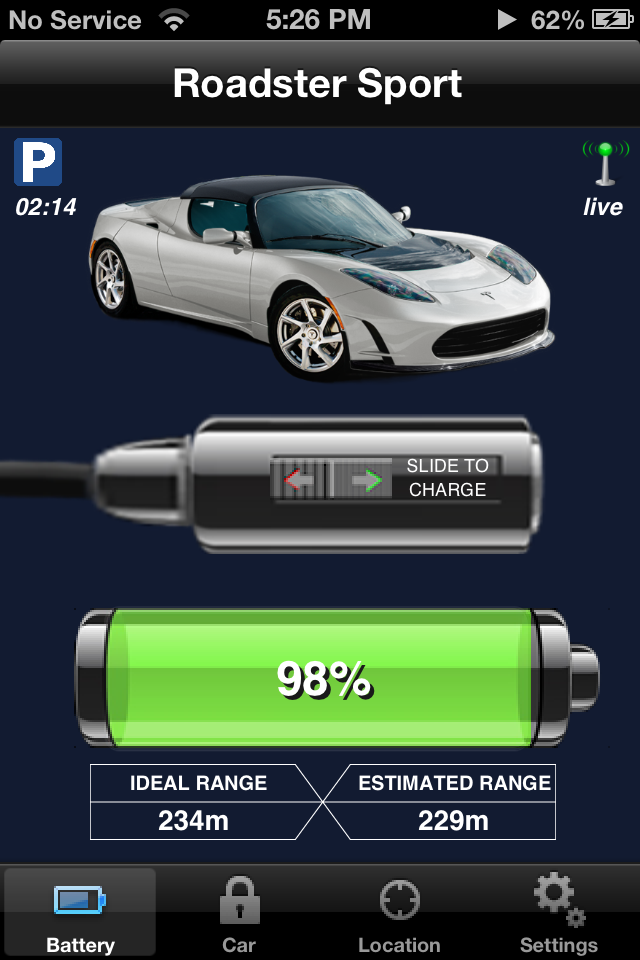
-shortly after charge completed. (stayed like this for a while)
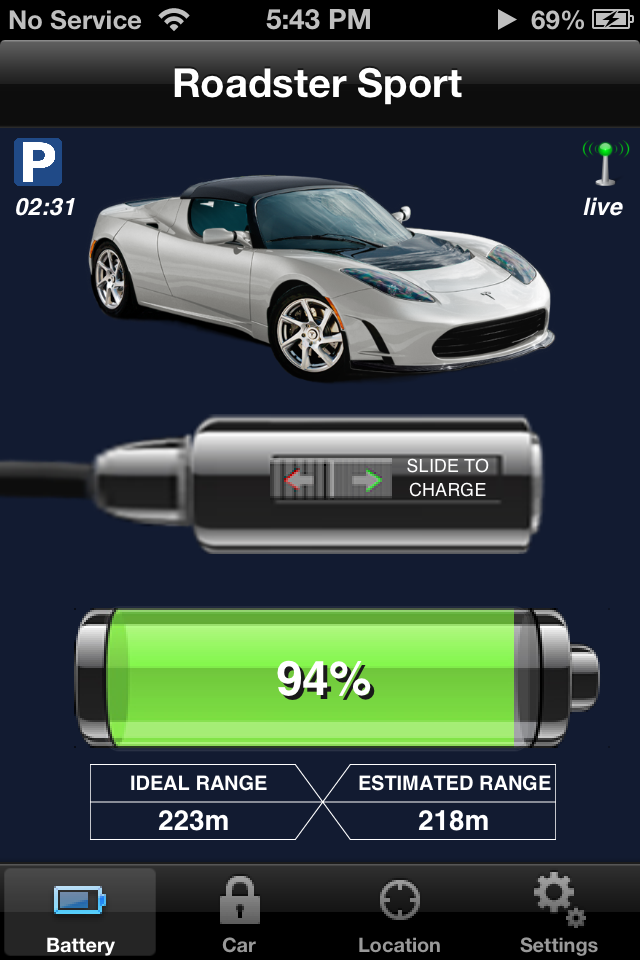
Suddenly dropped to 94% about 1/2 hour after charge was finished.
-wow big images, should have scaled them down.�
Mar 17, 2013
tomsax Do you have the latest version of VMSParser, 0.9.18, released on March 4th? It shows minimum and maximum brick voltages, and the corresponding brick numbers, from the 1-minute charge records.
Try this command: VMSParser -c <log_file_name>, or VMSParser -c -t <log_file_name> if you want a tab-delimited file to import into a spreadsheet.
That's pretty typical. You can't take a reading right after a charge or drive seriously. 225 ideal miles in Range mode is consistent with your CAC value. (It would be great if you'd do an update to your survey data with your range mode number.)�
Mar 17, 2013
smorgasbord OK, but while I do have holes, I also have a lot of data. And the parser spits out how many seconds the battery has spent at each temperature, as well as how many seconds the battery has spent at each SOC. I don't know the math, but it does seem like one could use that info to build a model that correlates those to CAC. You'd just ignore the holes and hope that the data retrieved is indicative of the data missing (it would be in my case since I have more data than holes).
- - - Updated - - -
Looking at the PI America Survey here's the CAC vs Mileage chart:
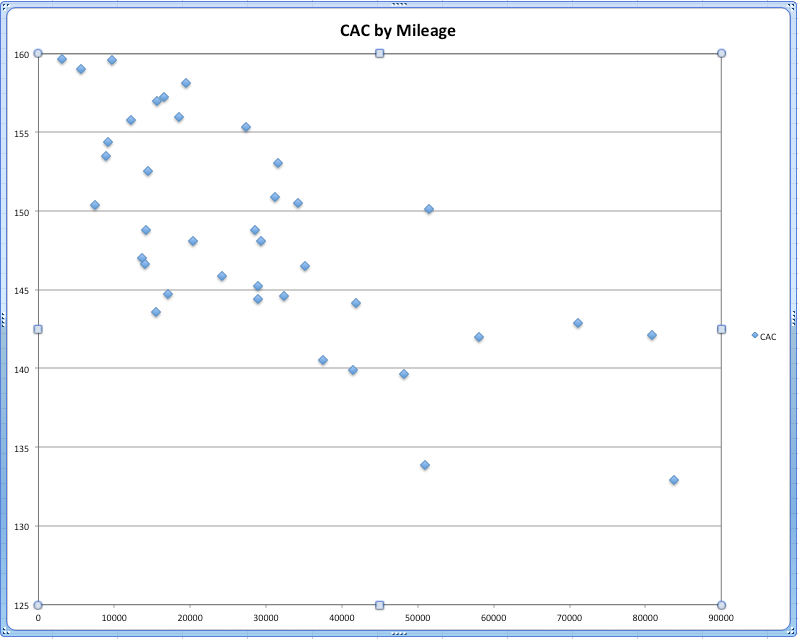
While there is a definite top-left to bottom-right overall trend, mileage doesn't tell anywhere near the whole story. There are low-mileage cars with low CACs compared to cars with three times the mileage, as well as high mileage cars that have very well preserved CAC values.
It'd be interesting to come up with a single value to represent "time spent at temperature" and plot CAC against that. Higher temps are progressively worse, so coming up with that single time-at-temp value would probably be logarithmic or similar.�
Mar 17, 2013
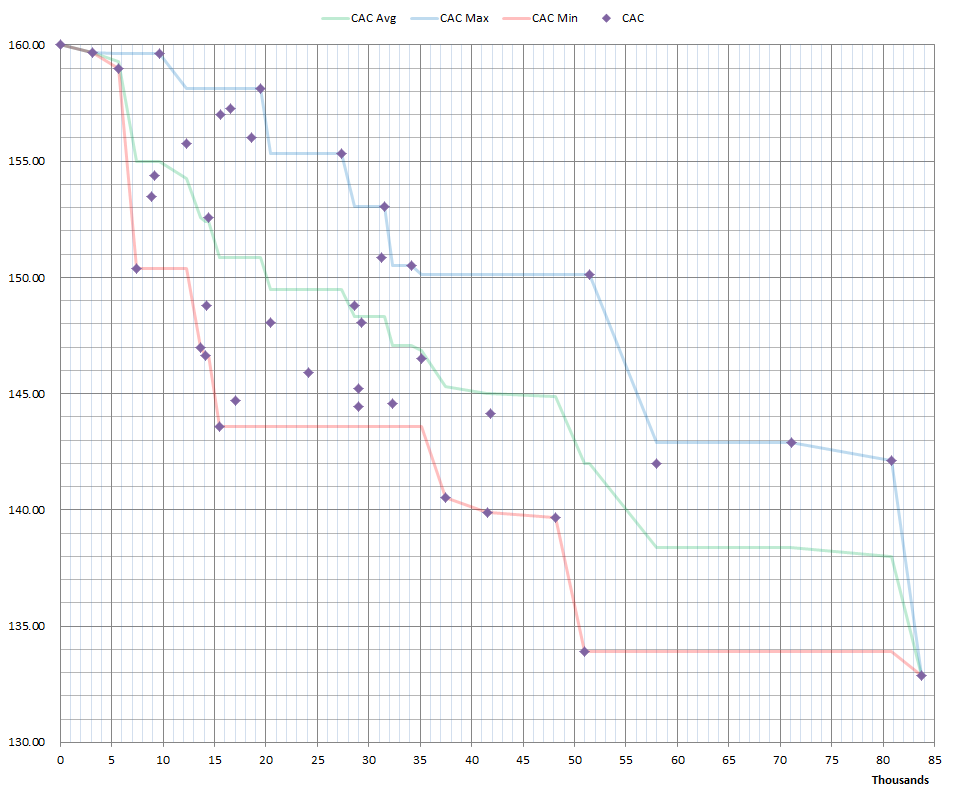
brianman Using Smorg's data (Thanks!), here's another flavor of the "CAC by Mileage" chart. I couldn't get it to make the curves I was looking for, but the result was interesting (to me at least) nonetheless.
- CAC - Original data.
- CAC Min - Adjust all "higher than previous" data points to match prevous data point.
- CAC Max - Adjust all "lower than next" data points to match next data point.
- CAC Avg - Midpoint between CAC Min and CAC Max at each data point.
 �
�
Mar 17, 2013
tomsax What is "Smorg's data"? Is there a data set with CAC values other than the Plug In America Survey data?�
Mar 17, 2013
brianman Looks like the same data, Tom. Didn't mean to confuse the attribution. Smorg sent me a copy of the data for his chart, and that's what I meant.�
Mar 17, 2013
smorgasbord As I said in my earlier post, the data was taken directly from the Plug-In America Survey.
- - - Updated - - -
It would be interesting to see if there's a correlation between battery temps ("seconds at temp" as output by VMSParser) and where the car is relative to the red and blue lines.�
Mar 17, 2013
tomsax That's cool, I just wanted to make sure I hadn't missed something else smorgasbord had done. I wondered if there was another data set.
At some point soon, I'll make it easy for anyone to download the whole PIA survey data set.�
Mar 18, 2013
Pantera Dude
Thanks a million for doing this stuff Tom!!!
I really enjoy looking at the info!
Art�
Mar 18, 2013
smorgasbord OK, so I thought about this some more, and talked it over with a smart friend at lunch. As a first stab, calculate the Median Temperature at which the car's battery has been kept. That's the temperature at which half of the life of the battery has been spent below and half spent above. It's different than mean, or average. Now, plot CAC against that median temperature for all cars.
Unfortunately, I don't have temps vs Seconds for all cars, just my own. My car's median is just below 21 degrees C. Here's what my data looks like:
This maybe can be used on cars of similar age and mileage to see why one battery has more CAC than the other, and I think it would be useful to plot this for all Roadsters for which we have CAC numbers. Unfortunately, Richkae's survey doesn't have CAC and Plug-in America's survey doesn't have the Seconds at Temp data. Somehow, we'd want to correlate the two.
This is going to have serious limitations. It doesn't help comparing cars of same age but different mileage or same mileage but different age. I think what we want to do is use median temperature as a factor by which we increase/decrease the effective mileage on a car's battery. My thinking is time at high temps explains much of the CAC differences we see in different cars at the same mileage.
At any rate, I'm stymied by the lack of correlation between this survey and Plug-in America's. Tom and Rickkae, any chance of you two getting together and use reported VINs to correlate the two for me?
Anyone have a better idea of what the temperature factor might be?�
Mar 18, 2013
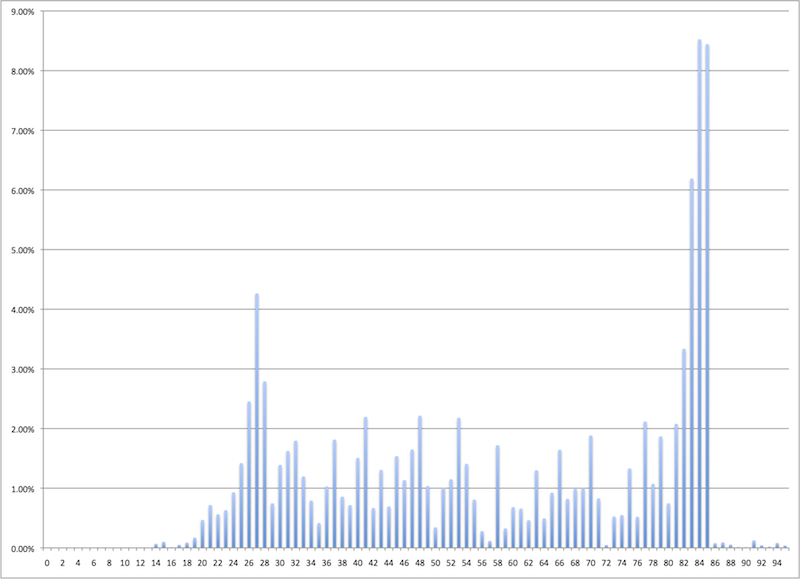
djp And to take it one step further, we could do the same with time spent at SOC. The US Army did a longevity study on LiCoO2 batteries (same chemistry as the Roadster). They measured capacity against three factors: charge cycles (mileage in our case), temperature and SOC. They found the capacity loss caused by high temperatures could be completely offset if the battery is kept at <50% SOC. It would be interesting to reproduce their results based on actual Roadster data.
http://www.cerdec.army.mil/directorates/docs/cpi/Cycled_Aged_LiIon_Cells.pdf
Here's the time spent at SOC for my pack:
 �
�
Mar 18, 2013
smorgasbord I'm thinking all of the Roadsters' Time at SOC will look pretty similar, and that Tesla knows what it's doing in that regard. I believe that even at full Standard charge the batteries are just fine, and even at Range charge, thanks to the active cooling, that batteries are also fine. I don't think we'll find a good correlation between Time at SOC and CAC. I do believe Time at Temps, though is a factor.�
Mar 18, 2013
hcsharp I agree that time at SOC probably won't have much correlation with CAC. I used to think, as you do, that time at temp would be a bigger factor especially since the reactions that cause the battery to lose capacity happen exponentially faster as temps rise. But I'm not so sure anymore. This is not a Leaf. The people I know in warm climates don't seem to be losing range any faster than I am in VT where we have about 2 weeks of summer every year. OK, maybe 6. Looking forward to the analysis if we can do it.
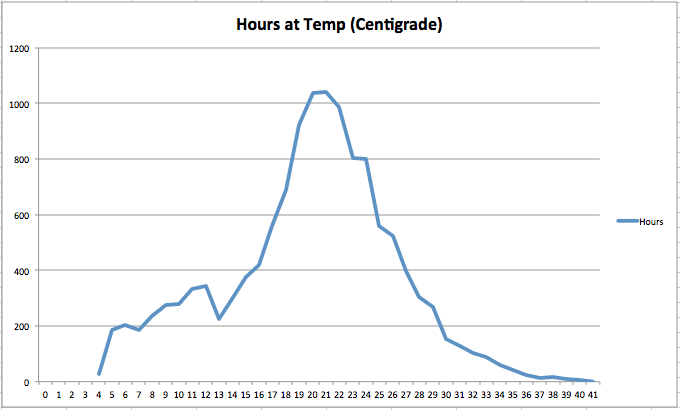
Can you tell me the command line you used to get the data for the graph in post 217 (hours at temp)?�
Mar 19, 2013
Eberhard my CAC climbed back to more then 143Ah from a little less then 140Ah 5000km ago after traveling that distance within 6 weeks time and plenty of time between charges to balance the batterie pack out. Because of the distances, if charged several times in range mode too, making it sure to leave just after finishing charging leaving little time to balance.
The reason, why my batterie pack appears in a relative good shape, i always traveled my long distance with average of 55mph while consuming 120-130Wh/km. Less consumption per miles means less degradation for the battery pack. Currently my reading is 143.09 Ah after more than 131.000km.�
Mar 19, 2013
JRP3 That sort of goes against the physics of lithium cells and why Tesla limits the use of higher SOC. Electrolyte solvent breakdown increases at higher voltages, independent of temperature, though higher temperatures can increase that breakdown as well. It is a chemical reaction after all. What you may be seeing is that cars with more time at higher SOC are not actually spending that much more time at those levels compared to other cars to show much of a difference.�
Mar 19, 2013
smorgasbord "VMSParser.exe -b *.tar >output.txt"
You'll need all of your log tar files in the same directory. It outputs in seconds.
I know that my battery gets hotter in the summer than in the winter, but I think it's more about how hard you drive and then how long you let the car sit before charging (which cools the battery).�
Mar 19, 2013
tomsax I have a theory on where the CAC is stored in the log file. I need values from a v2.x Roadster to test my theory, which requires capturing CAC values and log files at specific times. If you're interested in helping, send me a PM.
I think the thing that hurts the battery is high current flow when the batteries are hot. Even short times there, like tens of minutes, may be a significant factor. In order to test for that, we need Roadsters with complete log file sets. How many owners have complete log sets?�
Mar 19, 2013
jaanton What if each cell is fused (as in has an individual fuse) rather than switched? If a cell shorts, then a lot of current will want to go through that one cell which can easily blow an individual fuse isolating that bad cell from the brick. If a cell fails open then it's out of the loop anyways. Why have active control (via a transistor) vs passive (via a fuse)?
�
Mar 19, 2013
tomsax In the discussion subthread being referenced, it was proposed that the Roadster can balance 69 strings of single cells, one from each brick. Having a fuse on each cell won't do that.
Each cell does have a fuse. See Tesla's 2006 white paper on battery design, "The Tesla Roadster Battery System" by Gene Berdichevsky, Kurt Kelty, JB Straubel and Erik Toomre.
I wonder if these safeties would help Boeing.�
Mar 19, 2013
jaanton My belief is that each brick has 69 cells in parallel. Each sheet (which has 9 bricks) can reconfigure itself into either series or parallel arrangements of its bricks. When the bricks are in series, the sheets have 36v each so with 11 sheets you get about 396v. When the bricks are in parallel, the sheets have 4v each and the 11 sheets together get you 44v.
When the Roadster is On, the brick mode is series giving the high voltage. When the Roadster is Off or charging, the brick mode is parallel. When the bricks are in parallel all the cells in a sheet are effectively in parallel which allows them to balance all those cells in the sheet when the car is off. When charging, the charger can supply up to 400A at 44v to the sheets. This works out nicely. When the car is on, we have up to 600A at 396v drain possible; when charging we have up to 400A at 44v via a buck converter with input from 100vac to 250vac; when off each sheet of cells can balance. Note that 400A and 600A make the wiring work out nicely. Each brick when charging is getting about 44A @ 4v then each cell is getting about 0.65 A at 4v which is a comfortable rate of charge. Even if couple cells are dead it seems ok.
The charging numbers are 70A @ 250vac giving 17.5kW which converted to DC and voltage lowered by buck conversion is about 400A @ 44v.
�
Mar 19, 2013
tomsax From your previous post, I thought you were arguing that the individual cells don't need to be switched. How do you propose that the pack can reconfigure itself without having switches/transistors on each cell?
Of course this discussion belongs on its own thread, it has nothing to do with RichKae's battery study.�
Mar 19, 2013
JRP3 I'm convinced all Boeing needs to do is lower the operating voltage of the pack since even battery packs that did not catch fire had swollen cells, evidence of overcharging.�
Apr 29, 2013
tomsax We now believe we can extract the CAC from the log files, plus or minus 0.03 Ah. Using the latest version of VMSParser, there's enough resolution on the data extracted to get a full CAC history, which is the same as the min brick amp-hours, but using a slightly different scale factor. So now, Rich's study has both CAC and the "seconds at temp" data.�
Aug 14, 2013
smorgasbord I've been pulling CAC values using OVMS for a few months now. My current value today, after 24,642.6 miles and 28 months is 157.43. That makes my battery quite the outlier (see previous chart below).
Note that it had dipped into the 153's back in Jun, but has been steadily rising ever since. My last few full Standard Charges have resulted in 185 miles of Ideal Range after sitting for several hours.
Here's my recent data:
Apr 23, 21,007.7miles: 154.96
Apr 24, 21,053.7miles: 154.96
May 12, 21,381.7miles: 155.35
May 16, 21,579.3miles: 155.70
May 20, 21,647.2miles: 155.17
May 30, 22,050.0miles: 155.36
Jun 12, 22,515.1miles: 153.62
Jun 14, 22,673.2miles: 154.07
Jun 19, 22,861.0miles: 154.32
Jun 28, 23,054.4miles: 153.79
Jul 03, 23,196.1miles: 154.17
Jul 11, 23,351.9miles: 154.67
Aug 09, 24,544.6miles: 157.03
Aug 14, 24,642.6miles: 157.43
�
Aug 14, 2013
qwk Wow, very cool. I so wish we could extract this info for the Model S. It sucks that Tesla is so secretive about this stuff.�
Aug 14, 2013
shrink How do you do that? Do you send an SMS command? I saw a CAC value once when I received a text after stopping a charge by unplugging, but I wasn't sure if there was another way to get the CAC.
Thanks.�
Aug 14, 2013
markwj SMS "STAT" will get it to you.
P.S. Next version of the Apps will also show it on the (i) display.�
Aug 27, 2013
rgjones FYI Here is some anon data from weekly Tattler v2 service posts;
Car#1 Odometer 31,649mi CAC=150.60
Car#2 Odometer 27,637mi CAC=150.18
Car#3 Odometer 37,094mi CAC=147.02
You can manually get the cac value with, not surprisingly, the 'cac' command.
Perhaps more useful: 'odo. cac' to get the mileage (or kilometers if you prefer) at the same time.�
Aug 28, 2013
Timothy Is there a way to get historical values? I'd love to see where I started out and get the in between values. I was told the CAC should have been 160 when the car was new 5/2011. The first reading I got was when I had my car serviced 12/2011 CAC=153, next service 12/2012 CAC=147. My first reading off the OVMS was 4/2013 at CAC=146. Now CAC=145.
Not as good as Smorg's great numbers!�
Aug 28, 2013
markwj The CAC detection logic has been back-ported to the log file parsers, so you might have some luck there.�
Aug 29, 2013
Timothy Smorg--Help! I'm only a biology type. How do I translate this into English? i.e. is there a manual or directions to follow?�
Aug 30, 2013
markwj I think this might help:
Tesla Graphical Log Parser - Page 11
and instructions for pulling logs:
Tesla Graphical Log Parser
and Tom's excellent command-line VMSparser:
VMS Log Parser for Tesla Roadster
Regards, Mark.
P.S. Biology is all greek to me.�
Aug 30, 2013
rgjones thanks for the roll up Mark - very helpful.�
Không có nhận xét nào:
Đăng nhận xét