May 9, 2016
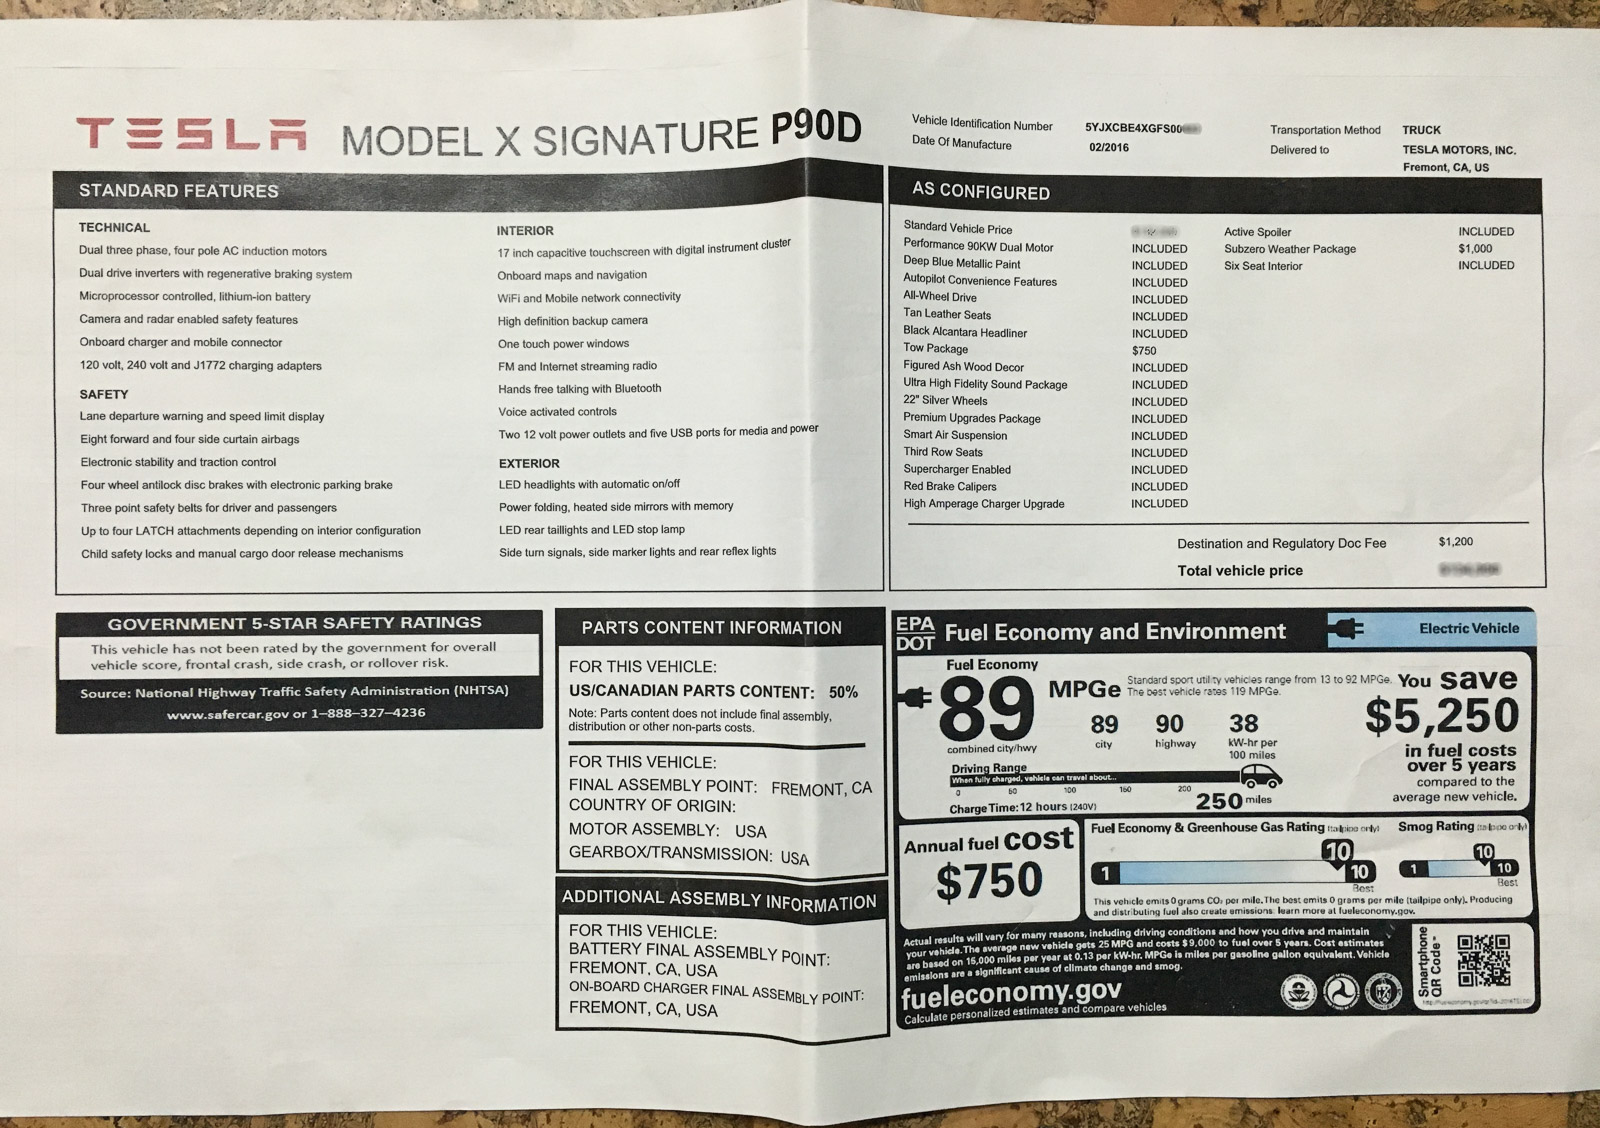
stevezzzz It gets curiouser and curiouser: I found the Monroney sticker for the 2012 Sig S, and it claims the same 38 kWh per 100 miles.
 �
�
May 9, 2016
ohmman IIRC, there were other errors on the stickers. Some listed rear facing seats, for instance. I get the feeling they aren't a very reliable source of information.�
May 9, 2016
systemcrashed Just look at the fuel savings estimate, they are off by almost $4,000!") �
�
May 9, 2016
NJ Plugin The fuel savings is likely because the cost of gas is lower than it was 4 years ago. Also, maybe the average of all cars is a bit higher now.�
May 9, 2016
dwebb66 The early sigs came with a mocked up sticker, take a look at the options listed on your sticker and see is same are Model S only (I do not recall the specific items), if they listed the Model S options then they likely have other copy/paste issue also.�
May 9, 2016
stevezzzz @dwebb66: if you look at the photos I posted, my car is not that early, with a February 2016 build date; neither is anything on the Monroney sticker obviously mocked up: all the features and options are appropriate for a Sig X P90D.�
Jun 5, 2016
Gzrgmr
The Inn that is in front of the SC has a very good restaurant and bar. Try their french toast with ham and swiss!�
Jun 5, 2016
Saghost Apples and oranges. The EPA efficiency numbers are from the wall, including conversion and charging losses.
The car reports kWh and wh/mile from the battery pack - and according to some threads, the car may not be including all power used (there seems to be some question as to whether HVAC and overhead/vampire while the car is on gets included.)�
Jun 5, 2016
Saghost Assuming all the numbers on both sheets are accurate and that the testing is the same (both of which I believe to be true,) the only possible conclusion is that the 90 kWh X draws about 6% *less* energy from the wall than the early 85 kWh S does.
This may sound odd, but I think it is actually correct. Something changed either about the car's charging or the way Tesla/EPA tested the car around the time of the D release. If you look at EPA numbers for an early 85 and an 85D, you can clearly see there's a discrepancy:
Compare Side-by-Side
As you said, the 2013 S85 gets 265 miles of range at 38 kWh/100 miles - meaning 2.65*38 = 100.7 kWh from the wall consumed during the test run.
But the 2015 85D gets 270 miles of range at 34 kWh/100 miles - meaning 2.7*34 only 91.8 kWh consumed.
Obviously the car is a little more efficient in driving, which is where the extra 5 miles of range come from.
In my opinion, though, the really interesting question is where did those other 9 kWh of power go to. At this point, the only two answers I can see are a significant improvement in charging efficiency or a change in the test protocols. (Tesla never re-rated the S85 before they discontinued it - a 2015 still shows the same numbers as the 2013.)
There was a lot of discussion about what this discrepancy meant at the time of the D introduction, with no real answers reached that I saw.
In the meantime, your X getting 250 miles at 38 kWh/100 miles => 2.5*38 = 95 kWh consumed makes reasonable sense - it is charging somewhat higher than the 85s do with a post D efficiency or test protocol.
The 2 significant figure kWh/100 mile numbers are probably why you only see a 3.2 kWh apparent difference from 85 to 90 - a 2016 S P90D shows 94.5 kWh with this method, while a 2016 S 90D shows 97.
Compare Side-by-Side�
Không có nhận xét nào:
Đăng nhận xét