Feb 4, 2015
Benz There already are similar threads for China and Europe.
The US is the primary market for Tesla Motors.
Let's gather all the Tesla related information regarding the US market in this thread.
For January 2015 there have been mentioned several sales/delivery numbers:
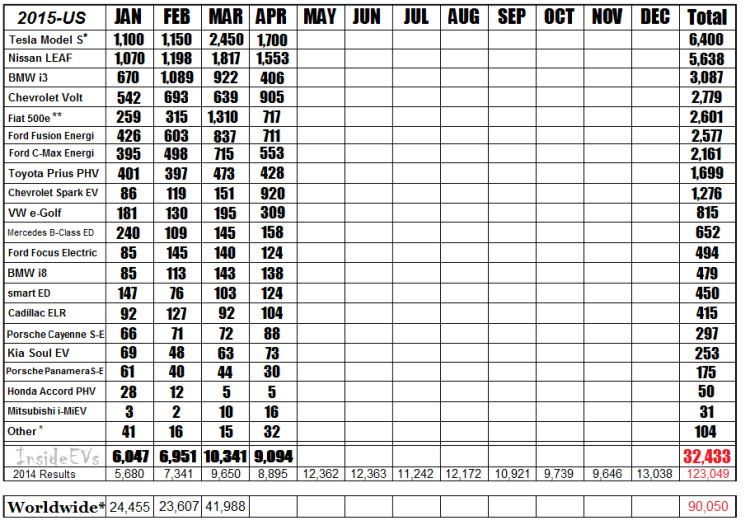
Inside EVs: 1,100
Link: http://insideevs.com/monthly-plug-in-sales-scorecard/
HybridCars (January 2015 Dashboard): 1,300
Link: http://www.hybridcars.com/january-2015-dashboard/
Best Selling Cars Blog: 2,250
Link: http://bestsellingcarsblog.com/2015/02/usa-january-2015-general-motors-strong-in-market-up-14/#more-49885
The real numbers should be somewhere inbetween.
And as time goes by, more information will be reported.
It's very likely that the numbers reported from a particular US state will be more accurate.
All we have to do is add them up.
Let's do that in this thread.
Cheers�
Feb 5, 2015
Benz The California New Car Dealers Association (CNCDA) publish their California Auto Outlook every quarter on their website.
The sales figures of the Tesla Model S can be found in the Luxery and Sports segment (and also look further down the document).
2012 Q2: 8 (June)
2012 Q3: 109
2012 Q4: 1,113
2012 total: 1,230
2013 Q1: 2,406
2013 Q2: 2,308
2013 Q3: 1,823
2013 Q4: 1,793
2013 total: 8,330
2014 Q1: 1,533
2014 Q2: 954
2014 Q3: 1,239
2014 Q4: ?
2014 Q1+Q2+Q3: 3,726
2012 + 2013 + 2014 (so far) = 13,286
Maybe someone can find Tesla Model S sales numbers from other US states as well?�
Feb 5, 2015
RationalOptimist Wild that California (pop 38m) did the same sales in 2013 as all of Europe (pop >300m) did in 2014. You could view that as disappointing by Europe. Or you could view it as untapped potential.�
Feb 9, 2015
chickensevil I think because of VA not yet allowing a Tesla "dealer" it is unclear if the registration data for VA is counting Tesla at all. If it is, it could either be under "imports - other" or "domestic - other".
Just so we might be able to figure this one out here is their list of manufacturers:
Imports:
ACUR
BMW
FIAT
HOND
HYUN
INFI
JAGU
KIA
LEXU
MAZD
MERC
MITS
NISS
OTHR
SUBA
TOYO
VOLK
VOLV
Domestic:
BUIC
CADI
CHEV
CHRY
DODG
FORD
GMC
JEEP
LINC
OTHR
Assuming Tesla falls under the Domestic - Other category then the total number for January is listed as 17. Given the above list, thankfully all the companies I can think of that would normally fall in a low volume "other" category would also be an import, so what other domestic seller is not already listed above?
Data pulled from here:
Statistical Reports | Virginia Automobile Dealers Association | Driving Virginia Since 1943�
Feb 20, 2015
Benz 2014 Q4: 2,384
2014 Q1+Q2+Q3+Q4 = 6,110
2012 + 2013 + 2014 = 15,670
Link: http://www.cncda.org/CMS/Pubs/Cal_Covering_4Q_14.pdf�
Feb 20, 2015
bonaire If you look at the reservation Tally breakdown of either the Model S back in 2013 when TMC was tracking reservation numbers - or the Model X Tally thread now which shows the breakdowns by region - the ratio was about 4:1 or so of North America to Europe. So, California and Europe track somewhat closely. Whether it is untapped advertising to educate people more in order to place a new order or not - the balance of interest appears to be relatively constant between Model S ordering and Model X ordering when comparing the two regions. In one compare, the NA total vs. European total of Model X is as follows 4.5:1 based on 18010:3929. Not sure if it is "conclusive" but I'd say the California market and European market demand are roughly about the same.
It seems to be getting better now versus back in 2013. It may be that Europe is "picking up" comparatively.
Model S mid-March 2013 US Prod:EU Prod about 6:1
19,984:3,002
(numbers above are reservation #s and not deliveries - by which reservation numbers are indicative of demand)�
Feb 23, 2015
Benz Total global Tesla Model S deliveries
2012 + 2013 + 2014 = 2,650 + 22,477 + 31, 655 = 56,782
15,670 / 56,782 = about 27.6%
So, about 27.6% of all global Tesla Model S deliveries in the past 3 years were delivered in California.
What does that mean for the total number of Tesla Model S deliveries in California in 2015?�
Feb 23, 2015
schonelucht I expect model S sales in California to be lower in '15 if Tesla manages to bring Model X to its customers by the 3rd quarter. Based on prior history, California will get prioritized deliveries for the new car. With a backlog of 20k, few California-S slots will be left in the production schedule.�
Feb 25, 2015
chickensevil It depends on if they are sacrificing the S delivery schedule to accommodate the X or if it is added on top. Based on the shareholder letter of 800 MX a week by the end of the year, it almost sounds like they are going to take the MS to 1200 and then go flat from there for the rest of the year. So it will give the appearance of "peaked" demand... but I don't necessarily think that will be the *real* peak. (note that is a run rate of about 60k a year of MS).�
Mar 9, 2015
Benz There are currently 27 live Supercharger stations in California. And in Q1 2017 this total will have increased to about 50. I think that this will be certainly helpful to increase sales numbers of the Tesla Model S in California in 2015 and beyond.�
Mar 28, 2015
Ingenieur Any thoughts on March US Sales?
Can we beat Dec 2014?
If EU is 4000 for Q1, NA at 6000 and Rest at 1000, thats beat of 1500 cars�
Mar 28, 2015
Ingenieur What are you talking about regarding last sentence?
As for 100 PT, this is where i see the stock long to mid term, im willing to play the upside if there is a beat on deliveries.
Sorry that i actually post information on this forum you wont find nowhere else, especially regarding Chinese market, i wrote about scalpers being responsible for bulk of orders back in October and attacked by permabulls like you.
The way i see things play out: Big beat on deliveries announced by Mid April, stock goes to 220, then loss 200+ Mio -> down, see why i ask?�
Mar 28, 2015
daniel Ox9EFD 1) Great idea for a thread. This was certainly missing.
2) Optimists/pessimists/profession+"-ists": please lets get back on topic.
3) Besides looking at InsideEVs numbers, is there any way to bound the uncertainty on NA numbers?
If it is 1100, 1150 for Jan, Feb, it doesn't look like a beat. But the estimate were all over the place. One way to solve this would be to take a weighted average, with weights by prior accuracy. But being too lazy for that, perhaps someone has a good estimate, preferably based on registration numbers?�
Mar 28, 2015
daniel Ox9EFD Some estimates:
InsideEVs estimates (http://insideevs.com/monthly-plug-in-sales-scorecard/):
Jan: 1100
Feb: 1150
hybridcars estimates (http://www.hybridcars.com/february-2015-dashboard/):
Jan: 1300
Feb: 1400
Average:
Jan: 1200
Feb: 1275
Ratio of March sales to average Jan+Feb in 2014: ~1.2
Using same ratio for this year:
Mar: 1485
This gives an estimate for total US for Q1: 3960
Assuming US is around 50% of world production, expecting total deliveries in Q1: ~8000.
For a beat they need an extra strong US in March or extra strong Europe.�
May 7, 2015
RobStark Perfect storm may be coming where Model S is number one BEV sold in America!
 �
�
May 8, 2015
SR22pilot Georgia has removed its $5K subsidy for electrics and added a $200/yr tax. While this may hurt Tesla a little I think it will crater the Leaf. Leafs are everywhere around the northern Atlanta metro area. Nissan says Georgia is responsible for a third of all US Leaf sales. That means this change is very significant.�
May 8, 2015
svp According to this - Focus2move | USA Light Vehicle Sales - April 2015
2205 Teslas sold in April, not 1700..�
May 8, 2015
Gerasimental This number, as well as that posted by Rob are just estimates made by the respective websites that publish them, since Tesla doesn't release monthly sales information.
What I find odd is that they disagree so wildly about Q1 numbers, with InsideEVs having 4700, vs 6082 (=8287-2205) for focus2move.
However, it seems from the EU thread that April EU numbers are 800+X, well below the 1200 required to achieve the same numbers as Q1 without an end of quarter push.
I expect therefore that we will see a heavier focus on US deliveries this quarter. That way Q2 has good margins despite the �/$ situation while Q3 will see far more deliveries to the EU, being a mixture of those at the old (lower) and new (higher) price, slightly softening the blow from very low margins on EU cars ordered before last week.�
May 8, 2015
svp Gerasimental, yes, just estimates. Another number here - 1650 - EV Sales: USA April 2015
Regarding end of quarter push, we'll start seeing how that changes monthly numbers distribution when May and June numbers come out.
He may have just referred to the last few days frenzy. Hard for me to see Norway deliveries for example at just 700 this quarter (230 in April * 3).�
May 8, 2015
bonaire It is because GA gave the rebate to people doing 2-year Leases on Leafs. Making the car basically free for a year. GA should have considered purchase-only and something like $4000 per sale. Doing a quick 2-year lease will cause a glut of them on the used lots fairly soon. I see the next-gen Leaf having 150 mile or more range and that is what may help them sell at the same level as today. The 80-mile range limit was good for hard-core BEV enthusiasts but they need the triple-digits and more for real folks to buy them.�
May 9, 2015
Car4CivilizedAge Based on previous quarters my guess Is deliveries in norway are a lot higher the last two
months of the quarter.�
May 18, 2015
RobStark  �
�
May 19, 2015
RobStark California Registrations Year to Date through March 2015
Luxury and Sports Sedan?http://www.cncda.org/CMS/Docs/Cal%20Covering%201Q%2015.pdf
Model Registrations % Share
BMW 5 Series 2707 12.8
MB E Class 2605 12.3
Tesla Model S 2535 12.0
Lexus GS 1680 7.9
MB S Class 1119 5.3
Electric vehicles have 8218 registrations or 1.7% market share, all time highs.
PHEVs down to 1.1% from 1.6 % all time high.
Hybrids down to 5.2% from 6.8% all time.
Tesla matches its all time high overall California vehicle market share of 0.5%.
Buick has 0.4% market share.
Volvo & Lincoln both have 0.3% market share.
Jaguar has 0.1% market share.�
Jun 3, 2015
RobStark Estimates for May 2015
MotorIntelligence 1,900
Wards Automotive 1,652
Insideevs 2,400
�
Jun 3, 2015
techmaven Someone's not right.
:smile:
The spread is merely about $70 million dollars.�
Jun 9, 2015
32no I do not trust any of the estimates for Tesla Model S sales in US, they are all throwing darts at a board, but I trust one estimate over the others.
According to Ward's Auto, Tesla only sold 13,785 units in US in 2014. Very clearly not trustworthy.
I have no comment about Motor Intelligence because I see their data very rarely and no one seems to compile a chart of it.
InsideEVs seems to be the go to source, but I've been very skeptical, and it appears rightfully so, since today at the Shareholder meeting Elon showed a slide of Q1 NA sales and the Model S was ~5500 sales. InsideEVs estimated 4700 for NA. InsideEVs seemed to be off many times before, and this gap is huge, which means their estimates are shaky at best.
The best estimates, I believe, are from Hybrid Cars. This chart compiles the monthly data from hybrid cars, which separately estimates US sales and reports actual Canadian sales. They estimated 4,900 sales in US and Canada was 397 sales for the first three months, which brings Hybrid Car's estimate to 5,297 for NA. Only 203 cars off vs 800 cars for InsideEVs (3.7% vs 14.5% error).�
Jun 9, 2015
svp 32no, thanks, Hybrid Cars seem like a good source. I do want to point out that I think 4700 was INsideEvs estimate for US alone. (vs. 4900 US for Hybrid Cars). Still, HybridCars seem to be closer.
In any case, their April and May numbers combined are actually very similar (4200 HybridCars vs. 4100 InsideEvs). If so, this seems to be way above Jan-Feb deliveries. Same situation in Europe.
If June numbers will be similar to March, we may see a significant "beat".�
Jun 9, 2015
32no Good points, but the InsideEVs estimate is indeed for NA:
 �
�
Jul 15, 2015
hobbes Market research firm claims exact number for Model S:
That is about 24% more than the insideEVs estimate of 4700 discussed here before!
IHS Offers Precise U.S. Data On Tesla Model S Registrations In The First Quarter - Forbes�
Jul 15, 2015
bonaire In terms of registrations - it may be those P85D delivered during the end of December push were officially registered in January. Would be nice to see their registrations by month and not by quarter.
Also, Tesla has the right to claim a sale in Q4 that is paid for in full in December on the 31st or prior and delivered in January (ie. Texas cars pre-paid and on a truck on Dec. 31)�
Jul 15, 2015
schonelucht Seems plausible because otherwise, there would only be about 700 cars delivered outside US/EU but including Canada. Seems too low to be realistic.
AFAIK, Tesla provided numbers are always deliveries, ie car in the hands of the customer.�
Jul 21, 2015
Benz 2014 q4: 2,384
2014 q1+q2+q3+q4 = 6,110
2015 q1: 2,535
2012 + 2013 + 2014 + 2015 q1 = 18,205�
Jul 21, 2015
StapleGun This is exactly right. I gathered some registration data a couple years ago, exploiting the fact that the way the VIN is determined leads to a relatively small number of possible Tesla VINs. A few states (Georgia and Texas are two I remember) have publicly accessible data on registrations if you know the VIN. I got a pretty good sized data set of legitimate VINs and compared their registration dates to the dates people posted on here that they recieved delivery. The average registration date was about 25 days after the delivery date.�
Aug 12, 2015
RobStark 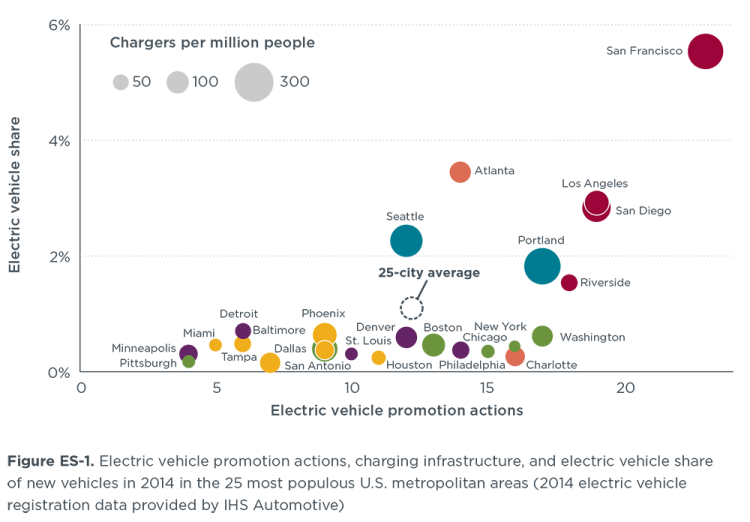
Highlights of the report includes a very interesting graph with a comparison of the 25 most populous metropolitan areas in terms of EVmarket share (vertical axis), EV promotional actions (horizontal axis) and charging points per million people (the size of the circles). Every state has a different color.
Why Top 25? Because together those metropolitan areas represent more than 42% of the population, 46% of auto sales,67% of new electric vehicleregistrations, and 53% of the public electric vehicle
charging infrastructure in the U.S., as of 2014.
http://insideevs.com/study-electric-car-promotion-uptake-top-25-u-s-markets/
�
Aug 21, 2015
RobStark Through June 2015 California Market
Tesla has 0.5% of the overall California Market the highest ever.
Top "Luxury and Sports" Models Registrations Market Share Mercedes E Class 5409 12.6% BMW 5 Series 5267 12.3% Tesla Model S 5148 12.0% Lexus GS 3105 7.0% Mercedes S Class 2446 5.7%
BEVs have 1.7% of the overall California Market the highest ever.
PHEVs have 1.2% of the overall California Market down from 1.6% last year.
HEVs have 5.5% of the overall California Market down from 6.8% in 2013.
http://www.cncda.org/CMS/Pubs/Cal%20Covering%202Q%2015%20Ver%202.pdf�
Aug 22, 2015
RobStark 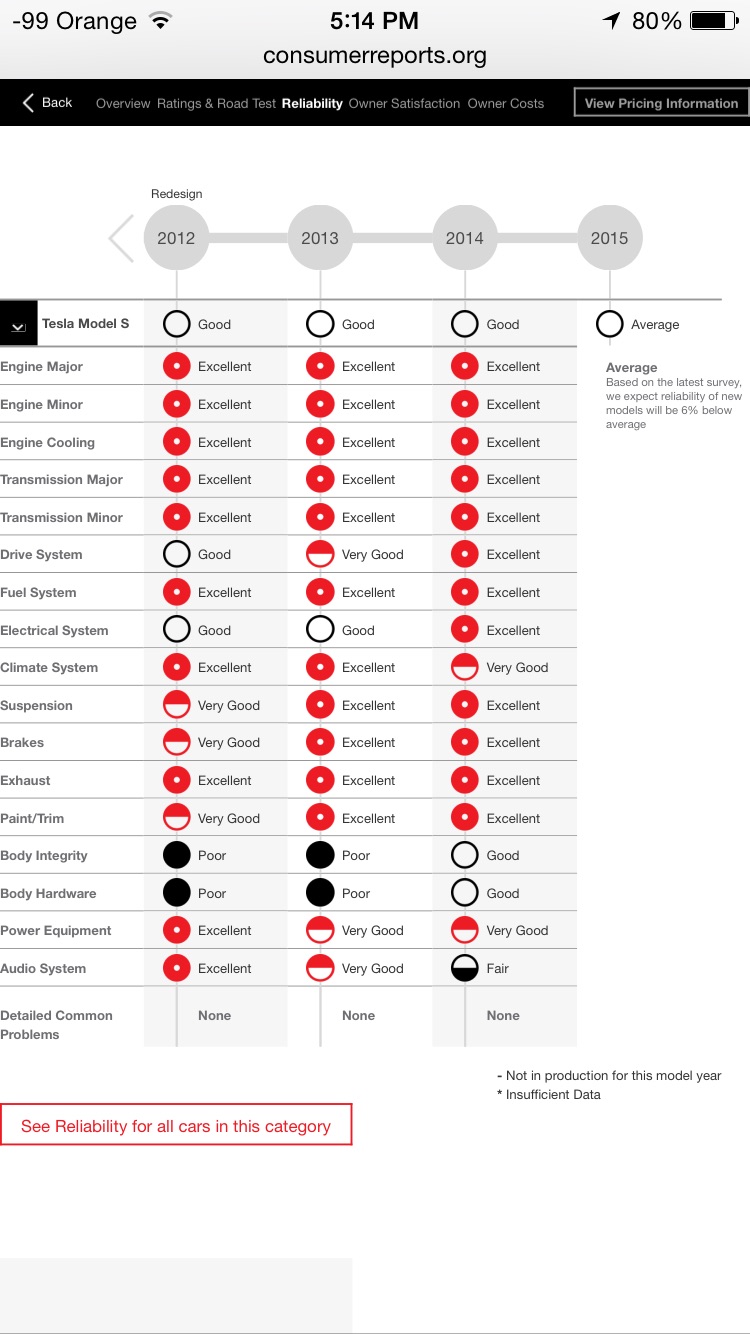 �
�
Aug 22, 2015
neroden OK, I have no idea what they mean by "body integrity". I've heard of drivetrain problems, paint problems, assembly problems, but I've never heard of a single "body integrity" problem; the body appears to be absolutely rock-solid stable and has required no repairs for anything short of a crash. There's something whacked about that rating, unless it means something totally different than what it sounds like.�
Aug 22, 2015
RobStark It means something is not perfect with the body of the car. Excessive panel gaps, misaligned gaps, trim not aligned, trim coming off. These are self-reported problems per 100 cars by owners themselves. The early Model S had problems with the rear glass adhering to the liftgate causing noise problems and there were owners reporting moisture inside the taillights. There also reports of leaking Pano roofs, creaking noisy Pano roofs, and other problems with Pano roofs characterized in various manners.
The number of problems are really tiny on modern cars but they are graded on a curve. The best,Lexus LS, has 70 "problems per 100 cars" that can include individual imperfections in the paint job.. The worst, some VW and FCA cars, have about 134 problems per 100 cars. When it comes to overall reliability ratings CR does not distinguish between a 1 mm smudge in the paint or inoperable engine. A problem is a problem.
Many VW and FCA owners rail against Consumer Reports but the fact is good ratings help tremendously in sales and poor ones hurt.�
Aug 23, 2015
Chickenlittle Always need to define variables. For instance what is a charge point? Every home, or at least almost every home has electric outlets, these can be charge points. Do they mean commercial public charge points? 240 volt 30 amp circuits are in almost all homes as well. How are they surveying whether in the garage or not?�
Aug 23, 2015
RobStark Obviously, they mean public charging points. If you click the link they specify.
Private homes would hardly show statistically significant differences between cities and would matter little to potential buyers in various cities.�
Aug 24, 2015
Benz How many more Tesla Model S deliveries in California will there be in H2 2015?
How about 6,000(+)?�
Aug 25, 2015
RobStark 
 �
�
Aug 25, 2015
RobStark 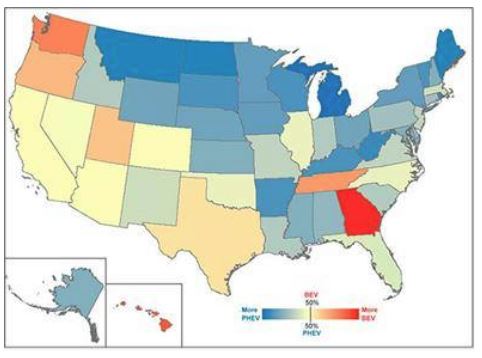 �
�
Aug 25, 2015
mspisars What's the source for this map?�
Aug 25, 2015
RobStark https://www.facebook.com/ClipperCreek/photos_stream
Clipper Creek is probably polling their own customers which bypasses Tesla owners so it probably skews PHEV.
But still enlightening IMO.�
Sep 14, 2015
RobStark 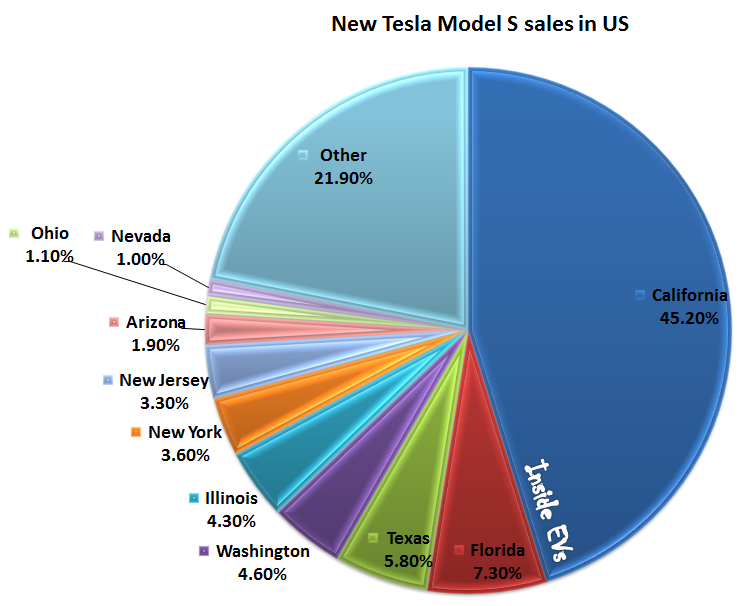
- - - Updated - - -
 �
�
Sep 14, 2015
hobbes Interesting - looks like there is a lot of growth potential even inside the US as sales are still very unequally distributed. Would be good to calculate this as Teslas per capita (California is the state with the most citizens in the US, right?).
For what time frame are those numbers?
---Updated---
O.k., found it here - original caption is "New Tesla Model S sales in US (*Data for All Tesla Registrations Since Model S Debut; Source: Polk, Edmunds.com)"�
Sep 14, 2015
RobStark CA has ~12% of US Population or about 10% more than Canada.
Per Capita is useful but so is straight numbers too.�
Sep 14, 2015
RobStark Here are the population-weighted figures for new car sales. California still dominates but Washington does quite well. Texas, not so much. Surprisingly, Nevada is 4th in sales per capita.
State Sales % per 10 million
- California 11.6
- Washington 6.5
- Florida 3.7
- New Jersey 3.7
- Nevada 3.6
- Illinois 3.3
- Arizona 2.8
- Texas 2.1
- New York 1.8
- Ohio 0.9
Other 1.7
Per Coilied on Insiveevs.com
�
Sep 15, 2015
hobbes Cool, thanks. So (conservatively) assuming California market is saturated and also assuming (not so conserveratively) the other 9 states will eventually have the same per-capita number of Teslas, that gives
11.6%*10 / Sum(per capita % over all states) = 116/40 =approx 3
So that would mean just in the top ten states they could still sell 2x (3-1 for the cars already sold) as many cars (in addition) as they already have sold in total. As the other 40 states have even less, under the assumptions above that would lead to a approximation of of 5 times that of the top 10 states or still 10x as many Model S to be sold... Quite a staggering number. Even if all the other states got only half as many Model Ss as California a factor of 5 or so would still not be too bad. And that is only Model S...
�
Oct 12, 2015
RobStark 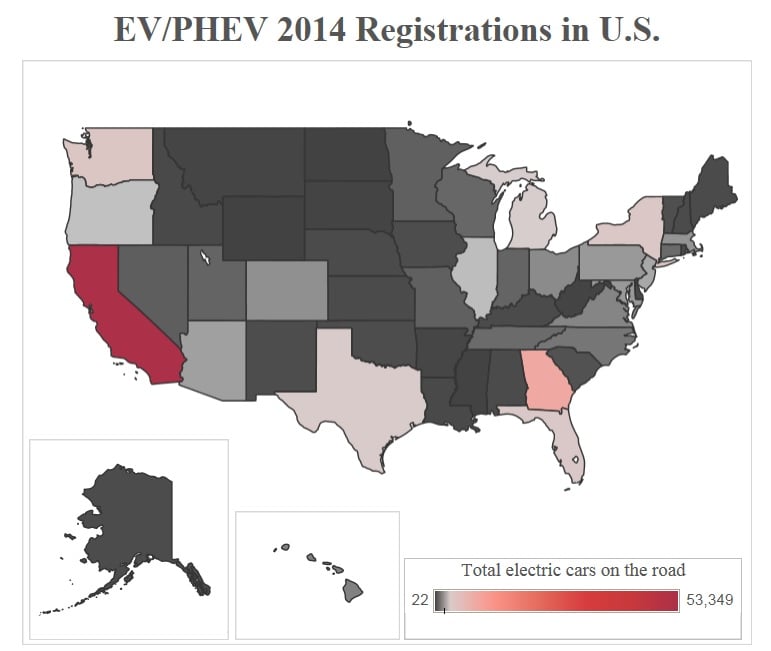
In article about Tesla at cnbc there is an interactive graphic shows distribution of EV registration across the US States for entire market as well as by brand.
http://www.cnbc.com/2015/10/10/-would-buying-a-tesla-really-cost-you.html
�
Oct 12, 2015
mmccord I found this humorous:
No sales tax on an NJ Tesla purchase isn't a remarkable incentive? For real? I live just over the border in NY and paid $8538 in sales taxes, and would have paid $0 in NJ. It is, in my opinion, the best state incentive out there.�
Oct 19, 2015
chickensevil Depends on the state, Mine is around roughly 5k$ for a Tesla (depending on your options and such). But that still isn't a bad incentive... sadly, VA has no incentives, and in-fact has anti-incentives as they are taxing EVs to pay for their "fair share" of the road use.�
Oct 24, 2015
RobStark  �
�
Nov 10, 2015
RobStark 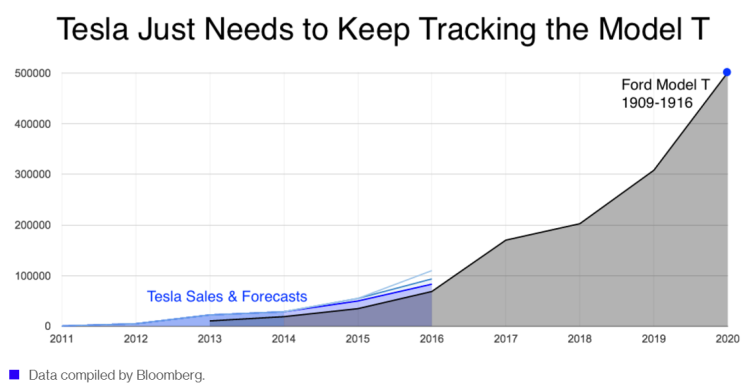 �
�
Nov 11, 2015
Benz Best Selling Cars Blog
US
October 2015
Tesla Model S: 1,730
January - October 2015
Tesla Model S: 17,030
Link: http://bestsellingcarsblog.com/2015/11/usa-october-2015-all-time-record-year-now-a-true-possibility/�
Nov 11, 2015
schonelucht Inside EVs estimates 1900 in October for a year to date total of 18900. We can now estimate NA sales per quarter fairly accurately. The biggest unknown are sales outside China, Europe or North America in countries like Japan or Australia. I put them down as 'elsewhere' in the table below.
Total deliveries
China
Europe
Elsewhere
North America
InsideEV estimate
Q1
10045
-797
-3491
-500(?)
=5257
4700
Q2
11532
-883
-3905
-600(?)
=6144
6900
Q3
11603
-1345
-3341
-700(?)
=6217
5400
October
4000(?)
-500(?)
-985
-250(?)
=2265
1900
�
Nov 11, 2015
electracity Japan on some reports is said to be #2 on the list of millionaires per country. Japan doesn't seem to be a priority, so obviously factors other than ability to buy are important.
I am really interested to see China Q4. They better be buying a lot of Tesla products if they are the major influencer of product development.
Tracking Germany separately would be a meaning indicator of base European interest. They have never had incentives (I think), and Tesla is investing heavily in that country.�
Nov 20, 2015
RobStark Tesla California market share for Q3 2015 is .5% vs .3% last year.
BEV market share is 1.6% same as Q2. That means Tesla has 31% of BEV sales.
Edit Mistook YTD registrations for Q3 registrations.
Luxury and Sports Car Market Q3 2015 YTD
Model Registrations Market Share Mercedes E-Class 8583 13.3 % BMW 5 Series 8207 12.7 % Tesla Model S 7336 11.4 % Lexus GS 4541 7.0 % Mercedes S-Class 3731 5.8 %
http://www.cncda.org/CMS/Pubs/Cal%20Covering%203Q%2015-CNCDA%20edits.pdf�
Nov 20, 2015
schonelucht Not so fast! 7336 is year to date. Q3 number is a much more reasonable 2187 source : page 3 of this report. What's impressive here is that this is up from 1239 last year. The Californian market for Tesla seems far from saturated.�
Nov 20, 2015
Benz Cumulative total global Tesla Model S deliveries: 89,956
Cumulative total Tesla Model S deliveries in California: 23,006
2012: 1,230
2013: 8,330
2014: 6,110
2015: 7,336 (=Q1+Q2+Q3)
California has taken a significant portion of the cumulative global total: 25.57%
What can we expect in Q4 2015?�
Nov 21, 2015
hobbes Good news from the state of Hawaii, too:
http://www.bizjournals.com/pacific/news/2015/11/20/tesla-among-11-brands-to-see-highest-growth-among.html?ana=yahoo
Guess the Model S is especially attractive there, as its only weakness compared to ICEs (range) is a non-issue on an island.�
Nov 21, 2015
tinm
Hawaii is a great place for a Tesla -- not only that, a Tesla 70D. No need to go all-out in terms of range. I mean, where ya gonna go? Even Big Island, on which I once put 1100 miles on a rental car in 10 days, is only so "Big." I can't wait to see the Model 3 on Hawaii -- a perfect car for that state. 200mi is plenty of range, more than enough. I hope Hawaiians keep buying boatloads of Teslas. (And PowerWalls and PowerPacks.)
Only thing I wish Hawaii had done years ago, if only it had had the guts to do it: put rail all over the main islands so people didn't need to drive anywhere near as much. It's such folly that the state didn't go for it when it could have.�
Dec 1, 2015
jesselivenomore November 2015 Plug-In Electric Vehicle Sales Report Card | Inside EVs
3200 for November.
�
Dec 3, 2015
Benz In 2016 the combined annual total US deliveries of the Tesla Model S, the Tesla Model X, the Chevrolet Volt, and the Nissan Leaf will be more than 100,000.�
Dec 24, 2015
RobStark  �
�
Dec 28, 2015
dalalsid That depends on how fast Chevy can ramp the '17 Volt. The '16 Volt is in a few states only. Also depends on how many people delay switching because Leaf 2, Bolt are around the corner and the '16 Leaf 1.5 is not exactly a steal.�
Dec 29, 2015
Benz In 2016 more people in the US will switch from ICE to Plug-Ins, because more people will come to the conclusion that Plug-Ins really are good enough for their daily driving needs, and that they will be fine without their ICE. And the 4 most popular Plug-Ins in the US in 2016 will be the Tesla Model S, the Tesla Model X, the Nissan Leaf and the Chevrolet Volt.�
Dec 30, 2015
chickensevil I was looking over the EU data and new pretty charts, so thought I would make a couple from the InsideEVs data set
Jan Feb Mar Apr May Jun Jul Aug Sep Oct Nov Dec 2012
12 19 43 86 300 400 1790 2013 1200 1400 2300 2100 1700 1350 1300 1300 1500 800 1200 1500 2014 800 1400 1300 1100 1000 1800 800 600 2500 1300 1200 3500 2015 1100 1150 2450 1700 2400 2800 1600 1300 2500 1900 3200

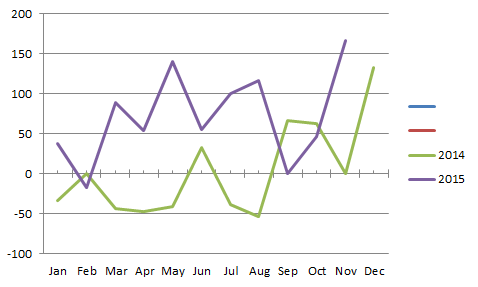
I didn't include the 2012/2013 data to make a Y/Y percentage chart because it threw off being able to really look at the 2014/2015 data. Also note that part of the Y/Y decrease on 2014 was contributed by the shift away from solely delivering to NA and pushed ROW sales. 2015 really was the year to push sales everywhere with little issue so I think seeing solid gains in the NA market Y/Y is quite good. The worst we saw was a lack of gain (0%) in Sept of this year and Feb (-17.86%).
Given what they pushed out the door for Q4 this year, I would expect a similar drop in Jan/Feb of 2016 as they are going to be trying to finally satisfy those EU orders they have held off on.�
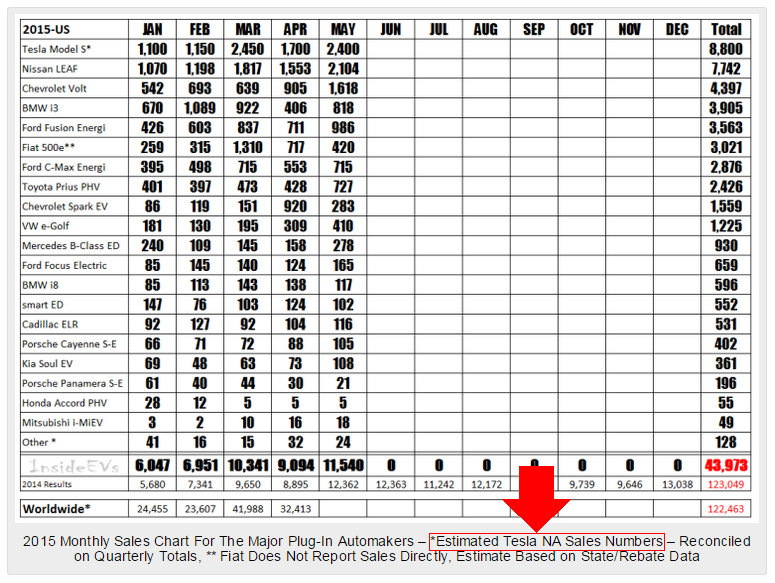
Dec 30, 2015
hobbes Thanks! Interesting, much less of a regular quarterly pattern compared to Troy�s plots for Europe. Should note though that the insideEVs numbers are "Estimated Tesla NA Sales Numbers � Reconciled on Quarterly Totals". But cool to see the yoy increase here, too.�
Dec 30, 2015
chickensevil I know the data isn't perfect, but it is the best we have for NA. Plus they have been pretty close that it should be accurate enough.�
Dec 31, 2015
Troy Hi. I have been working on quarterly numbers for North America and Asia. This is what I have came up with:
.
........... North America Europe
..............Asia
..............Australia Global
................California
..............California../
North AmericaQ3 2012 250 (1*) 0 0 0 250 (7*) 109 (9*) 43.60% Q4 2012 2,400 (1*) 0 0 0 2,400 (7*) 1,113 (9*) 46.38% Q1 2013 4,911 (1*) 0 0 0 4,911 (8*) 2,406 (9*) 48.99% Q2 2013 5,162 (1*) 0 0 0 5,162 (8*) 2,308 (9*) 44.71% Q3 2013 4,288 (2*) 1,224 (6*) 0 0 5,512 (8*) 1,823 (9*) 42.51% Q4 2013 4,223 (2*) 2,669 (6*) 0 0 6,892 (7*) 1,793 (9*) 42.46% Q1 2014 3,384 (2*) 3,073 (6*) 0 0 6,457 (7*) 1,533 (9*) 45.30% Q2 2014 2,127 (3*) 2,482 (6*) 2,970 (4*) 0 7,579 (7*) 954 (9*) 44.85% (5) Q3 2014 2,763 (3*) 1,583 (6*) 3,439 (4*) 0 7,785 (7*) 1,239 (9*) 44.85% (5) Q4 2014 5,315 (3*) 2,382 (6*) 2,072 (4*) 65 9,834 (7*) 2,384 (9*) 44.85% (5) Q1 2015 5,652 (3*) 3,453 (6*) 886 (4*) 54 10,045 (7*) 2,535 (9*) 44.85% (5) Q2 2015 5,630 (3*) 3,904 (6*) 1,938 (4*) 60 11,532 (7*) 2,525 (9*) 44.85% (5) Q3 2015 4,876 (3*) 3,516 (6*) 3,151 (4*) 60 11,603 (7*) 2,187 (9*) 44.85% (5)
...
Estimate (1*) North America sales = Global sales
(Tesla published quarterly sales numbers and the Model S was sold only in North America.)(2*) North America sales = Global - Europe
(Model S was sold only in North America and Europe. Both of these numbers are known)(3*) North America sales = California sales / 44.85%
(California New Car Dealers Association (CNCDA) publishes quarterly numbers for Model S sales in California. In previous quarters California sales accounted for 44.85% of North America sales)(4*) Asia sales = Global - (North America + Europe + Australia) (5*) The assumption is, California sales will remain around 45% of North America sales. (6*) Data we collected from institutions that publish car registration stats. Click on numbers for more details.
(7*) Published by Tesla. Click on the numbers for data source (PDF, shareholder letters).
(8*) These three quarterly numbers Tesla published were rounded down (4,900, 5,150 and 5,500). We adjusted them to match the 22,477 yearly sales number Tesla published on this following document: Page 65, FORM 10-K Annual Report, 2013
(9*) Published by CNCDA (California New Car Dealers Association). Click on numbers for data source.
The method I used:
From Q3 2012 to Q2 2013
The first 4 quarters are easy. The Model S was sold only in North America and Tesla has published sales numbers for each quarter. Therefore, North America sales = global sales.
...
North America Europe Asia Australia Global Q3 2012 250 (1*) 0 0 0 250 (7*) Q4 2012 2,400 (1*) 0 0 0 2,400 (7*) Q1 2013 4,911 (1*) 0 0 0 4,911 (8*) Q2 2013 5,162 (1*) 0 0 0 5,162 (8*)
From Q3 2013 to Q1 2014
These 3 quarters are easy too. The Model S was sold in North America and Europe. We already know the numbers for Europe and Tesla has published the global sales numbers. Therefore, North America sales = global sales - Europe.
...
...
North America Europe Asia Australia Global Q3 2013 4,288 1,224 0 0 5,512 Q4 2013 4,223 2,669 0 0 6,892 Q1 2014 3,384 3,073 0 0 6,457
I believe the Europe numbers are very accurate because the data comes from reliable sources like government departments or unofficial institutions like federations, unions or associations that work in this field. This wiki has links to data sources for each country.
The Problem
The tricky part starts in Q2 2014 when Tesla started selling the Model S in Asia. 2482 is Europe. 7579-2482= 5097 is non-Europe but how do you divide 5097 units between North America and Asia?
...
North America Europe Asia Australia Global Q2 2014 .........? 2,482 (6*) ............? 0 7,579 (7*)
CNCDA said 954 Model S were sold in Q2 2014 in California. Assuming California sales account for 44.85% of North America sales, the calculation for North America would be 954/44.85%= 954/0.4485= 2127 units. That means Asia sales would be 7579 - 2482 - 2127= 2970.
...
........... North America Europe
..............Asia
...............Australia Global
..............California California/
North AmericaQ2 2014 2,127 (3*) 2,482 (6*) 2,970 (4*) 0 7,579 (7*) 954 (9*) 44.85% (5)
Why 44.85% ? Because that's the average of previous 7 quarters. For first 7 quarters we already calculated North America numbers and California numbers were published by CNCDA. Therefore it is possible to calculate California sales as a percentage of North America sales. The last column in first table shows these percentages. They are fairly consistent. Their average is 44.85%. The assumption is, this will remain the same. This is the best method I could come up with.�
Dec 31, 2015
chickensevil Great data, Truly. I like the way that you came up with the numbers as it is a little different than anyone else had done previously.
That being said, the nice litmus test of your "44.85%" number as it looks like that is where the majority of your estimations end of derriving from is tested from the Year end report for 2014 by Tesla. They stated the following:
This means that the total sales was recorded as 31,655 and we take 55% of that to come out to a 2014 NA total of 17410 (rounded down). Your estimates come out to: 13589. To me, this signals that your CA percentages went down more over time. They 2014 CA percentage of NA sales looks like it would be around 35.09%
What is of course lost is the Q/Q granularity of that percentages you had. But from your number we can pretty safely say your 45.30% is correct, so we must down adjust the other three quarters (which is only going to drive the percentage lower). This comes out to (35.09 * 4 - 45.30) / 3 = 31.69 (yes, that doesn't quite add up correctly, but using more exact numbers the 35.09 is rounded down to begin with so 31.69 is more accurate I also used more precise numbers when dealing with your 45.30 number)
Total 2014 CA 2014 CA percentage NA Estimate (55%) APAC (15%) Europe (30%) 31,655 6,110 35.09% 17410 4748 9497
That said, once I reapplied the numbers back into the chart with the new calculations my NA totals exceeded the "55%" statement by around 400 units. So for Q4 specifically I adjusted the percentages upward to reflect 33.55%. This now perfectly lines up the NA numbers back to meet the golden number of 17,410.
So we have pretty solid numbers for each quarter for EU (yes, the reported numbers vs the percentages given is actually off by 24 units, but that is close enough of an error that it shouldn't matter too much). We also have solid quarterly numbers for NA that actually sorta make sense given what we knew happened with deliveries getting "stuck", so it makes sense for CA to go up for that quarter alone because they were originally going to deliver some 2400 extra cars that never got to their destinations in time. So now, subtracting out those values I come up with new APAC numbers that also fit the data (they are actually down by 24, which guess what caused that?) So here is the new 2014 data set:
I got nothing at the moment to help you with 2015 numbers, because after doing all that, it has completed destroyed making sense out of anything going forward. I'll keep playing with them until it seems to line up with what we know vs what we don't know.
........... North America Europe Asia Australia Global California California../ North America Q1 2014 3,384 3,073 0 0 6,457 1,533 45.30% Q2 2014 3,010 2,482 2,087 0 7,579 954 31.69% Q3 2014 3,910 1,583 2,292 0 7,785 1,239 31.69% Q4 2014 7,106 2,382 281 65 9,834 2,384 33.55% �
Dec 31, 2015
mmccord So they've only delivered 240 cars to Australia? And there are 6 superchargers there. Based on that ratio we should have 1200+ superchargers in USA by now.") �
�
Dec 31, 2015
chickensevil So running on the assumption that InsideEVs data isn't wrong (I know, big leap there), their quarterly chart would look like this for NA:
Applying this into the 2014 and 2015 data this updates Troy's information to look something like this:
....... Q1 Q2 Q3 Q4 2012
12 148 2490 2013 4900 5150 4100 3500 2014 3500 3900 3900 6000 2015 4700 6900 5400 5100
Sorry it loses the color code on it, Not sure how he got all that to work (unless he did it in HTML, in which case, he has more patience than I). But the note here is that I did not touch any of his numbers on NA until I got to Q2/2014 and made the rest of the data work within that boundary. This also means that CA percentages really are all over the place if you want to make that data set fit. If this is the case, then it really feels like they have been sacrificing deliveries to the Rest of NA something fierce (without really messing with CA) to facilitate deliveries to the rest of the world.
........... North America Europe Asia Australia Global California California../North America Q3 2012 250 0 0 0 250 109 43.60% Q4 2012 2,400 0 0 0 2,400 1,113 46.38% Q1 2013 4,911 0 0 0 4,911 2,406 48.99% Q2 2013 5,162 0 0 0 5,162 2,308 44.71% Q3 2013 4,288 1,224 0 0 5,512 1,823 42.51% Q4 2013 4,223 2,669 0 0 6,892 1,793 42.46% Q1 2014 3,384 3,073 0 0 6,457 1,533 45.30% Q2 2014 3,975 2,482 1,122 0 7,579 954 24.00% Q3 2014 3,910 1,583 2,292 0 7,785 1,239 31.69% Q4 2014 6,141 2,382 1,246 65 9,834 2,384 38.82% Q1 2015 4,700 3,453 1,838 54 10,045 2,535 53.94% Q2 2015 6,908 3,904 660 60 11,532 2,525 36.55% Q3 2015 5,400 3,516 2,627 60 11,603 2,187 40.50%
If that is true, then Q4 numbers are going to be quite interesting because I think this is the first time that we can honestly say they might have pushed the boundaries of what NA demand actually looks like. Because they really pushed sales in NA as hard as they could (or that is what it feels like)
- - - Updated - - -
That might be why they haven't really kept growing AU by as much? Or rather put off Supercharger expansion into 2016...�
Dec 31, 2015
Troy Hi chickensevil. Thanks for the information below. I changed the table to match those percentages. The latest version can be found in the Europe 2015 Model S sales wiki, half way through.
�
Jan 5, 2016
Benz According to Inside EVs there were 25,700 Tesla Model S deliveries in the US in 2015, that's more than 51% of the total global Tesla Model S deliveries in 2015 (50,366).�
Jan 5, 2016
RobStark The insideevs number includes ~1500 Canadian deliveries. So ~48% of global deliveries are US deliveries.
BTW Mercedes had 21,934 S-Class sales in the USA in 2015.
Tesla wins F-Segment sales race in the USA!!!�
Jan 6, 2016
Benz Isn't Canada geographically the largest and most northern state of the US? :biggrin:�
Jan 6, 2016
vgrinshpun I believe that IndideEVs is under reporting NA deliveries in December. Due to the goal of delivering in Q4 2K cars more than producing, close to 100% of cars produced in second half of November-first half of December had to be delivered - in December - within NA. Assuming average production rate of 1200 cars/week, this works out to about 5,000 cars delivered in December vs. 3600 per the InsideEVs.
Another way to verify that their December number does not add up, is to see that according to WIKI, European Q4 sales tracking to about 5.5-6K. Assuming a max of 2,000 sales in Asia/Pacific, together with InsideEVs NA projection yields a total of 7.7 + (5.5 to 6) + 2 = 15.2 to 15.7K vs. 17,192 MS actually delivered in Q4. So there is about 1.5 to 2K of sales "missing".�
Jan 6, 2016
Cattledog So Model S had approximately 24,000 US sales in 2015. I don't care if 17,400 was at the 'low end' of guidance for Q4, if someone had told any of us pre-launch in June 2012 that in 3 years the Model S would be the best selling luxury sedan in the US, we would all have smiled and then wondered what they had for breakfast.
Ridiculously great work by the design, engineering manufacturing, sales and service teams.
This is how you call a win a win!�
Jan 6, 2016
chickensevil We had the F-Segment in 2013 as well. It was just lost due to the S Class refresh happening last year (the refresh years tend to be some of the larger selling years) and Tesla pushing sales outside of the US in Q2 of 2014. So it is nice to see that they have production high enough that we can get back to and exceed the 2013 numbers. The MS is a much better car today than it was in 2013 as far as some of the missing luxuries people were complaining about, so I think that has also helped Tesla maintain and continue to grow.
But generally yes, by this point the design would be considered "tired" and our sales numbers should have been plateauing and instead it has only continued to grow!�
Jan 7, 2016
Benz How many of those 25,700 Tesla Model S deliveries in the US (+ Canada) in 2015 were in California alone?
About 10,000?
According to CNCDA, the total for the first three quarters stands at 7,336 (in third position, just behind the Mercedes Benz E-Class and the BMW 5-Series).
Link: http://www.cncda.org/CMS/Pubs/Cal%20Covering%203Q%2015-CNCDA%20edits.pdf�
Feb 15, 2016
Troy Hi everybody. Because this is the main topic for USA registration numbers, I want to post an update. As you might know, in this shareholder letter on 10 Feb 2016, for the first time Tesla published USA registration numbers for 2014 and 2015. The table on that PDF looks like THIS. I found Canada estimates HERE. This enabled more accurate estimates for North America. (I mean the yearly totals for North America are more accurate but the distribution of these totals to quarters is still a guess work). We already know the Europe numbers from the wiki project and we know the global numbers because Tesla publishes these too. That means we have now reasonably accurate estimates for Asia/Pacific. Full table with footnotes and color codes can be found HERE.
North America Europe Asia/Pacific Global YOY Quarterly Global Growth Q3 2012 250 (1*) 100.0% 0 0.0% 0 0.0% 250 (7*) Q4 2012 2,400 (1*) 100.0% 0 0.0% 0 0.0% 2,400 (7*) Not available Q1 2013 4,832 (2*) 98.4% 79 (5*) 1.6% 0 0.0% 4,911 (8*) Q2 2013 5,120 (2*) 99.2% 42 (5*) 0.8% 0 0.0% 5,162 (8*) Not available Q3 2013 4,288 (2*) 77.8% 1,224 (6*) 22.2% 0 0.0% 5,512 (8*) Not available Q4 2013 4,223 (2*) 61.3% 2,669 (6*) 38.7% 0 0.0% 6,892 (7*) Not available Q1 2014 3,384 (2*) 52.4% 3,073 (6*) 47.6% 0 0.0% 6,457 (7*) 31.48% Q2 2014 4,278 (3*) 56.4% 2,482 (6*) 32.7% 819 (9*) 10.8% 7,579 (7*) 46.82% Q3 2014 4,421 (3*) 56.8% 1,583 (6*) 20.3% 1,781 (9*) 22.9% 7,785 (7*) 41.24% Q4 2014 5,453 (3*) 55.5% 2,382 (6*) 24.2% 1,999 (9*) 20.3% 9,834 (7*) 42.69% Q1 2015 5,402 (4*) 53.8% 3,453 (6*) 34.4% 1,190 (9*) 11.8% 10,045 (7*) 55.57% Q2 2015 6,335 (4*) 54.9% 3,904 (6*) 33.9% 1,293 (9*) 11.2% 11,532 (7*) 52.16% Q3 2015 6,350 (4*) 54.7% 3,517 (6*) 30.3% 1,736 (9*) 15.0% 11,603 (7*) 49.04% Q4 2015 9,125 (4*) 52.4% 5,347 (6*) 30.7% 2,928 (9*) 16.8% 17,400 (7*) 76.94% �
Feb 15, 2016
chickensevil Thanks for the numbers update. I like having more solid numbers for 2014/2015.
Wow, that US demand... We pulled ahead of the old numbers from Q2 2013 in Q4 2014 and it hasn't really settled since. I expect Q1 2016 to to look similar to Q1 2015 where we are relatively flat and then should see solid numbers all year long. This should be Tesla's best NA year yet! I don't know if ~9k a quarter is sustainable but if it is, or if it can go even higher this is going to get quite fun to watch!�
Feb 19, 2016
RobStark 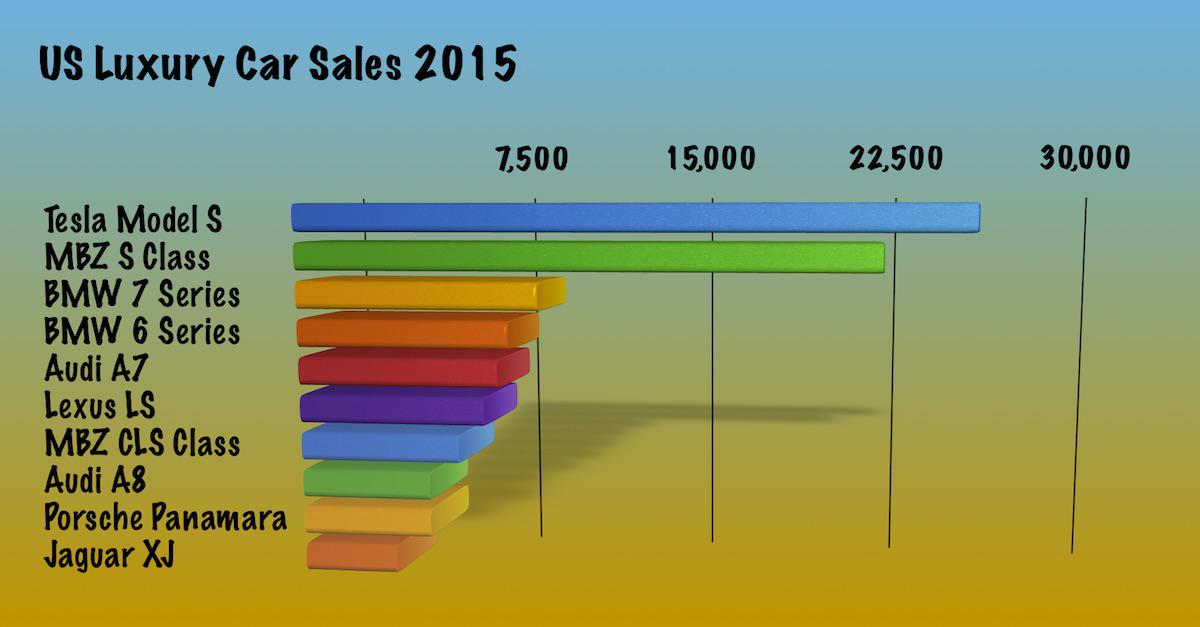
- - - Updated - - -
- - - Updated - - -
- - - Updated - - -
Wheres Tesla Worth? - Tesla Motors (NASDAQ:TSLA) | Seeking Alpha�
Apr 7, 2016
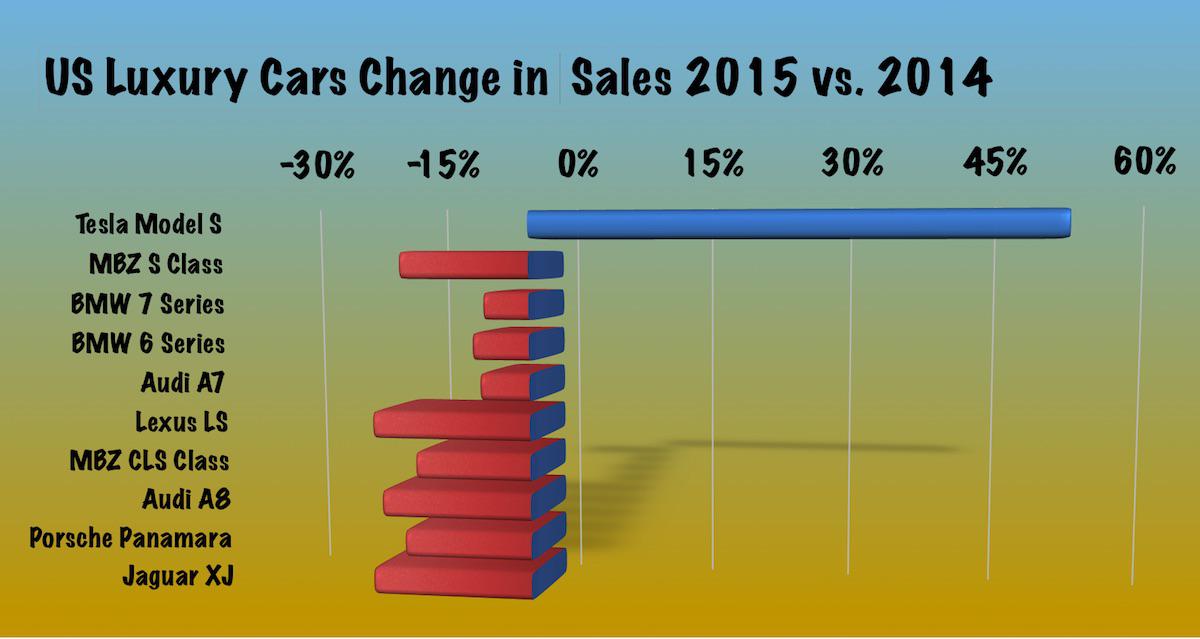
RobStark Large Luxury Car
March
2016
? March
2015 %
Change 2016
YTD 2015
YTD %
Change
Mercedes-Benz S-Class
1332
2098 -36.5% 4167 5096 -18.2%
BMW 7-Series
850
732 16.1% 2313 1941 19.2%
Lexus LS
469
676 -30.6% 1240 1848 -32.9%
Jaguar XJ
441
434 1.6% 1089 952 14.4%
Audi A8
422
461 -8.5% 985 1067 -7.7%
BMW 6-Series *
389
2434 -84.0% 839 4182 -79.9%
Porsche Panamera
334
433 -22.9% 963 1312 -26.6%
---
---
--- --- --- --- ---
Total
4237
7268 -41.7% 11,596 16,398 -29.3%
Large Luxury Car Sales In America - March 2016 YTD - GOOD CAR BAD CAR�
May 24, 2016
Benz California Q1 2016:
Luxury and Sports:
Tesla Model S
2552
Mercedes Benz E-Class
2445
BMW 5-Series
2068
Lexus GS
1143
Mercedes Benz S-Class
1068
Source: CNCDA
Link: http://www.cncda.org/CMS/Pubs/CA%20Auto%20Outlook%201Q%202016.pdf�
May 24, 2016
schonelucht There is something weird going on with the California report. When looking at the totals across all models, the FY report specifies 10743 while the 3Q report specifies 7336 tru September. So that leaves 3407 for October tru December yet the deliveries for the 4th quarter are reported on the same line as being only 3130. That's a difference of nearly 300! Seems quite a lot. What am I missing? If there are a lot of late registrations not included in the split by model number then that could mean California model S deliveries in Q1 actually increased y-o-y instead of declining from 2623 to 2552.
The report also allows to figure out the number of model X's sold : 20 in the last quarter of 2015 and 385 in the first quarter of this year. It's puzzling how this is less than 1/6th of the total US deliveries while California accounts for over 1/3th of the US model S's. You'd expect Tesla to especially have delivered the X to Californian customers first, yet that does not seem to have happened. Or is the X simply less popular in California compared to other states?�
May 24, 2016
Benz I think that the 2015 Q4 delivery total of 3130 must be an error.�
Jun 20, 2016
RobStark
Plug-Ins Take Nearly 4% Of The Subcompact Sales In The U.S.�
![[?IMG]](https://lh3.googleusercontent.com/blogger_img_proxy/AEn0k_vRmy74WlyUvjzUo5ulVHCBEep3UBCkcCYi0YLB7nQo8hOv4ixwiVAttfgceYs0qQAwW7Th4D7atOoLppK5o0IfXoJwGnJ5PkM8oT1zuNGu3KXaKq4eABrmp3JQ9uHfO2LHAmsxMg=s0-d)
Aug 8, 2016
RobStark ![[?IMG]](https://lh3.googleusercontent.com/blogger_img_proxy/AEn0k_vGhaNVV9MxINo_g91g8mjVN3uRwoTG_ZE9pOrhQoEuNB6yFTarX90lhNoXipbibS77N8D2qNMyr-qdgtBVtLv359pttHyLkkIMnHZTFWAPPR4vAOrDyY8AITOJpADdFA0oY_g=s0-d) �
�
Aug 9, 2016
bonaire I have posted "for years" that the plug in market will grow "slow and steady". Looks like that. On inside EVs, I upgraded my annual growth for 2016 from 8% growth to 12% growth year over year for the entire market after the June/July numbers came out. That is for all plug-in varieties. Bolt will not make much of an impact until 2017. Ford is doing surprising well and consistently but I don't believe hangs as tough through the end of the year. MS/MX 60 will help and could push that to 15% growth if paired up with continued strong Volt sales. Leaf not expected to do much.
Remember too that 2015 was a down year overall from 2014. So, slow and steady she goes. No hockey stick on the horizon yet.�
Aug 13, 2016
SBenson Spot on. We will have to wait for Model 3 for a hockey stick.�
Aug 13, 2016
bonaire I vote for "acceleration" but given the existing market of say 135,000 in the USA for 2016, consider 2017 being in the 200,000 total "take rate" and then 300,000 for 2018. Remember that Tesla's "500,000 Build Plan" is not "per-year". It is to build their 500,000'the car by some time in the year 2018.
And so, Tesla's total sales this year is about 70k, 120k+ in 2017 and 200k+ in 2018 (worse case late 2018). it's looking like 2018 may be "double" 2016. But we'll have to wait and see. Gas prices and other exciting factors are in play. Back in 2013 or so, I predicted 30% annual growth for the industry the next couple years. 2015 actually was less than 2014, so that prediction was "way high". This year, I am looking at 12% right now for the plug-in market growth (YoY entire USA market for 2016/2015).
I just did a nice road trip to the south. Saw zero plug-in cars after commuting 5 days to a work site and including a visit to a NASA site (one where SpaceX is doing testing on such things like their Raptor mars engine).�
Aug 13, 2016
Mario Kadastik I think you are mistaken bonaire. Teslas plan is to produce 500k cars in 2018, that's what the whole GF acceleration has been about. It'll be 100-150k MS/MX and 350-400k M3. The plan is to get M3 ramped in 2017 to a pace that can produce 350k M3 in 2018. Elon has said as much when he talked about bringing the M3 and GF plans of 2020 closer to 2018.�
Aug 13, 2016
Troy I think it might be 500,000 units per year because in THIS shareholder letter Tesla mentions a 5 fold increase. If production rate is 100K per year at the end of 2016, 5 fold would be 500K/year at the end of 2018. That's how I read it.
�
Aug 13, 2016
bonaire At the time it was written, the build rate was possibly 1700/wk. Five fold is 8500/wk. That is perhaps 425000 per year but it all depends on when the lines were written. Also, five-fold can be construed two ways. "Five times the current" and "Five times more on top of the current". Usually they talk about "build rate exiting a specific time". Maybe they mean to be able to reach a peak production rate nearing 10,000 per week but cannot guarantee that deliveries and demand match that number. But I presume that they want to be "able to" build at that rate. I don't believe that the lines that can put together can reach 10,000 per week production rate by 2018 - but I suspect that they want to try to get there. They are barely at 2000/week now, so it takes time, labor, factory retooling, supplier logistics and far more than just wanting to hit a number. Train and truck and ship logistics are key.
I have not yet seen a clear indication from Tesla that they mean "500,000" per year. They use somewhat obscure sentence structure. Perhaps not to be held to a specific guidance indication. This is why we have the bickering between the longs and shorts - because we have not seen exactness in these areas.�
Aug 13, 2016
Troy @bonaire,
In THIS video at 14:24 Elon says half a million cars per year. To me it is clear that they will make 500,000 S+X+3 in 2018. The Gigafactory was originally designed to support 500,000 cars by 2020. Then they moved that to 2018.�
Aug 13, 2016
RobStark 500k SEX per year by 2018�
Aug 17, 2016
RobStark Fact #937: August 8, 2016 Total Battery Capacity of all Plug-in Electric Vehicles Sold Increased from 2014 to 2015 | Department of Energy
![[?IMG]](https://lh3.googleusercontent.com/blogger_img_proxy/AEn0k_ttYJM8611NP_xN6q8ngKVoABdCA_I24pykc8u9FHmsEKIolaKs2tBMYYeokzfa4fr9feQ1yWpOS3AWxFZQeNiMM56klmHkSjOecGHCmbYW8ph4X3UiN9xX-RhDtZCGoA=s0-d) �
�
Aug 30, 2016
schonelucht There is a new California Outlook (Q2 2016) out and Tesla remains an exceptionally strong seller. 4967 cars, up from 2526 last year or nearly 35% of global deliveries (over both models).�
Aug 30, 2016
vgrinshpun The data in different portions of this Publication are not consistent. On page 2 registrations for Model S are listed at 5147, while total for Tesla on page 3 is 4967. How total (MS+MX) could be less then MS alone?
The Q2 publication listing total for Q1 at 2526, while Q1 publication lists total for Q1 at 2937 (??)
EDIT: Never mind - mixed up quarter data with YTD data - thanks to Oil4AsphaultOnly and Troy for pointing the mistake.�
Aug 30, 2016
Oil4AsphaultOnly I just took a look at it, and it's because of different columns have different scope. The 5147 was for model S sales in H1 2016, while the 4967 is Tesla sales (model S + X) for just Q2 2016. 4 columns to the right, you'll find 7904 as the Tesla sales for H1 2016.�
Aug 30, 2016
vgrinshpun Yes, thanks for keeping me straight. Time to go to bed, I guess...�
Aug 30, 2016
Troy @vgrinshpun,
5147 is Model S YTD, while 4967 is the Tesla number but just for Q2 2016. It says 7904 for Tesla YTD a few columns later.
No. 2526 is Q2 2015, not Q1 2016. This latest file doesn't directly show Q1 2016 Tesla number but it shows YTD and Q2 numbers. Therefore you can calculate:
Tesla Q1+Q2 2016: 7904 (Page 3. It says YTD)
Tesla Q2 2016: 4967 (Page 3)
Tesla Q1 2016 = 7904 - 4967 = 2937�
Aug 30, 2016
RobStark Luxury and Sports Car 2016 YTD
Model Registrations Market Share
BMW 5-Series 5207 13.2
Tesla Model S 5147 13.1
Mercedes E-Class 5050 12.8
Mercedes S-Class 2072 5.3
Lexus GS 1978 5.0
Tesla was 60 units from being tops in this segment.
CADA separates premium cars into near luxury( C Class 3 Series etc) and luxury/sports.�
1/1/2015
guest ![[?IMG]](https://lh3.googleusercontent.com/blogger_img_proxy/AEn0k_tD_6QcCm7I8IDmP1LXFEJmyHGTiVD2MlTWn59nvYn93KCWUFb7cy7xkqT7YT3x_WGS6EK4crkN_lc9n6wn1iGcBKe2S6TrPeD_2YP9ZZOGRTNCn_0Q4dzvIvSgBE8qbE2pXIQm=s0-d) �
�
1/1/2015
guest The federal administration must somehow tally up the number of Tesla vehicles for which the $7500 credit is applicable to know when the phase out period starts. Is it possible to request this information under the freedom of information act? Has anyone tried? Can a non-citizen from abroad do so? If so, I would but I don't know how it works at all. Maybe an interested American on this forum can start the process?�
1/1/2015
guest The U.S. administration is not responsible for counting each OEM is responsible for counting and informing the IRS when they have reached 200k American sales.�
1/1/2015
guest Interesting. How does the OEM know that a customer will claim the credit? Or does the phase out start after a set number of eligible cars, irrespective of wether the buyer actually took the credit?�
1/1/2015
guest @schonelucht,
The process is explained HERE (scroll down and expand the phaseout section). As of today, Tesla sold 90,790 units in the USA and they will reach 200K on 3 Dec 2017 according to my calculation. All the details and the daily counter can be found HERE (scroll all the way to the right).
Tesla's USA sales are mostly known because,
? In 2012 Tesla sold cars only in North America and they published their total sales.
? In 2013, they sold cars in North America and Europe. They published global numbers and we know Europe numbers from the wiki project.
? 2014 and 2015 USA sales were published by Tesla HERE (table 2 on page 1).�
1/1/2015
guest Thanks. So the phase out happens after 200k eligible cars sold, not after tax credits claimed. On of the links given by @Troy led me to a list maintained by the IRS of manufacturers and the number of cars sold. Unfortunately Tesla is not listed.�
Không có nhận xét nào:
Đăng nhận xét