May 28, 2015
jhm Many people have asked to have a thread devoted to Blind Faith Price Targets. So here's kicking it off.
Prior discussion of the methodology and BFPT updates occur at the following location. Going forward I hope to keep all updates and discussion in this thread.
The original idea roughly
Long-Term Fundamentals of Tesla Motors (TSLA) - Page 240
Simple update
Short-Term TSLA Price Movements - 2015 - Page 302
Buying near the bottom
Short-Term TSLA Price Movements - 2015 - Page 398
Update with application to a LEAP
Short-Term TSLA Price Movements - 2015 - Page 499
Update with a simple exit strategy
Short-Term TSLA Price Movements - 2015 - Page 538
Rationale of Long-Term Target with consideration of stationary storage
Short-Term TSLA Price Movements - 2015 - Page 578
Update and catching a nice pullback opportunity
Short-Term TSLA Price Movements - 2015 - Page 595
Update with good discussion from others
Short-Term TSLA Price Movements - 2015 - Page 689�
May 28, 2015
jhm Update and how to adjust your own long-term target.
Currently, Tesla is trading at $251, and with respect to a s3739.82 long-term price target for the end of 2025, that implies a 29.02% discount. This implied discount is at the 45th percentile for the last twelve months. So we are just a tad below netral sentiment. At this sentiment the BFPT 12 months out is $324, while the min sentiment BFPT is $257. So if you're time horizon is well beyond 12 months, the upside is fair and downside is pretty limited. Personally, I am already quite overweight on the stock, so I am not accumulating at these prices.
Some people may be interested in how these targets change if you assume a different long-term price target. Our LTPT is 10.603 years away, so while you could replicate the analysis with a different LTPT, I would like to suggest an approximation. It basically comes down to an adjustment to the implied discount rate. I will illustrate with an example.
Percentile
Imp Discount
5/28/2015
1/15/2016
5/28/2016
1/20/2017
45.45
29.02%
$251
$295
$324
$382
0
32.19%
$194
$232
$257
$308
25
30.23%
$227
$269
$296
$352
50
28.49%
$262
$307
$337
$397
75
27.47%
$285
$333
$364
$426
100
25.47%
$337
$390
$424
$491
The LTPT we have assumed is $3739.82. Suppose we believe a $5000 target is more suitable. Let's suppose we want the minimum sentiment 12 months out. The minimum sentiment BFPT for today is $194. So from this to $5000 in 10.603 years is an implied discout of 35.86% = (5000/194)^(1/10.603) - 1. Note that this is a few points higher than our previous implied discount of 32.19%. This is because we are now assuming a higher LTPT. To take this out a year we compute $263.57 = 194�(1 + 0.3586). So are original 12 month min sentiment BFPT was $257, but under the $5000 LTPT we get $264.
While $5000 is substantially larger than $3740, this difference only translates into a $7 difference in our 12 month target. For me personally, this is not a big enough difference to change my investment strategy, so I'm comfortable with making either long-term assumption. I'd encourage people to try their own sensitivity analysis to see if they are comfortable with the assumptions being made. I'd love to hear back what people find.
As always, make your own mistakes and good luck!�
May 28, 2015
adiggs Thanks for pulling this out into its own thread and providing the links to the back story. I haven't seen these previously but I like the info.�
May 28, 2015
SteveG3 Hi James. I just read your first post on the "Blind Faith Price Target" (post 2400 on the Long-Term Fundamentals thread).
I appreciate your effort, but I'm not totally clear on what the purpose of the "BFPT" is. Could you describe how this tool is meant to be used?
I ask you this as in reading that original post, I see you wrote,
"I call this the blind faith model. At the recent CC, Musk provided us with a back of the envelope estimate of market cap, $700B by 2025. So let's take it as a matter of blind faith that the stock price will reach $5500 by the end of 2025. After all, Elon said it, and that's good enough for me. So if the stock price grows exponentially from here to there, where does that put the price in 1 year, 2/19/2016?"
From having read many of your posts, I'm extremely confident you were not intending to suggest that anyone take Elon's $700B as a blind faith expectation for which to invest in Tesla, and you're "good enough for me" comment was just a joke.
I can, however, see the possibility of the Seeking Alpha crowd, or even Jim Cramer, disingenuously citing this as evidence that Tesla is a "cult" stock, and that Tesla bulls are no more than clueless fans of Musk. For over two years Cramer has been trying to hammer the notion that Tesla is a "cult" stock "that can't be valued" (in my view simply false statements to try to scare away investors). We've seen analysts, journalists, and the Seeking Alpha crowd all plumb TMC for scraps they can present out of context to support some gibberish they want to sell... I'm somewhat concerned about handing them a scrap that will fit so well with gibberish they've already invested two years of negative campaigning to create the impression their gibberish is common sense (that we're a bunch of market chumps with no sense of reality but only blind faith in Elon Musk).
Could you clarify what you see as the purpose of this tool and why you've chosen the $700 billion 2025 market cap as an assumption in its construction? Does the meaning of the tool in any way depend on the that target or was it something of an arbitrary input?�
May 28, 2015
JRod0802 I think this thread is more geared towards looking at what it would look like if Elon was right, and then comparing that to reality over time.�
May 28, 2015
Jonathan Hewitt Agreed. And as jhm pointed out you can change the final target by quite a bit and it doesn't changed out 1 year PT that much so having exactly a 700 Bil Market Cap isn't that big of an input.
Maybe the name should be changed to avoid bear FUD...�
May 28, 2015
jhm SteveG3,
I've added some annotation to the list of past posts in the OP to help people navigate the development of the idea. So I would encourage you to keep reading through that background ground because I think it will answer many of your questions.
The basic idea is to understand Musk's view of Tesla's long-term term growth potential. The most essential assumption he makes is that Tesla should be able to grow revenue by about 50% per year for the next ten or more years. Recent developments in stationary storage reinforce this outlook. The second key assumption is that Tesla will work towards a 10% profit margin across the business. This assumption is hard to support with recent experience, but Tesla has exhibited a strong commitment toward hitting gross margin goals. The combination of solid GM and scale does work toward realizing a solid profit margin some years out.
So if Musk's basic intention is to grow revenue roughly 50r per year will exercising profit discipline leading to 10% profit margin, where does that put Tesla in 2025? Revenue is about $350B and earnings at about $35B, whence the market cap of $700B follows from 20 times earnings. So that's the basic target.
The idea of a blind faith target is to suppose that the $700B market cap, or $3740 per share after allowing 4% annual dilution. Under that scenario, and it is just a scenario, the question is how much does the market really buy into that scenario. So if we look at recent prices, we can calculate an implied discount. Now the market has a great many good reason not to take Musk's $700B at full value. The is a tremendous amount of uncertainty that the market must price into that sort of grand vision. But it is what it is, and the market will discount it as much as it wants to.
However, the market does tend to swing from moments of bearish sentiment to bullish sentiment. The amont of discount does vary widely over the course of 12 months. So while market sentiment may be rather bipolar, the longterm vision does not change that much, and progress toward that vision continues it a fairly robust pace. Thus, we can interpet price swings and specific variation in implied discounts as mostly fluctuations in market sentiment. If we look at the distribution of implied discounts over the last 12 months, we can make the assumption that this distribution may not change that much over the next 12 months. Under this sort of distributional assumption, then we can deduce a distribution of near term price targets. These price targets are all indexed by the percentile of sentiment for discount and time to the long term target.
The upshot of this analysis is that we can guage market sentiment and this helps us with a trading strategy based on buying when sentiment is unsustainably low and selling when sentiment is unsustainably high. This suggest a long-term trading channel where the longterm trajectory is based on the company's long-term ambition, and the spead in the channel is calibrated to the last 12 months of trading. So users need to understand that if the longterm vision changes or progress toward that goal is substantially accelerated or decelerated, then the tool must be adjusted or abandoned. Also if sentiment tends to remain stuck too bullish or too bearish for more than half a year, then a 12 month calibration period may not be wide enough. We need to be able to look back over the last 12 months and see that the market has tested the extremes of sentiment. If sentiment does not cycle a few times in a year, the easy fix is to use more than 12 months of history. Additionally, we should expect a little bit of drift in the discount distribution, and this is why I prefer to look at just the most recent 12 months. The distribution will change over time, but we assume that Chang will be slow enough that nearterm price targets are well calibrated.
So with any methodology, we need to be alert to changing situations and reassess the adequacy of assumptions from time to time. In my updates, I aim to give updated estimates along with commentary to the present situations. This should help establish a track record and alert us to emerging issues. So far the method seems to have done a good job of identifying buying opportunities at prices below $210 in recent history. Moreover it cautioned against taking a profit too soon, and we have seen even today that holding out for bullish sentiment may be worth the wait. Always I caution people to make their own mistakes blindly following a blind faith tool. It is enough that this tool gages sentiment. It simply gives an investor a bit of perspective to aid in making a broadly informed decision.
So why do I call this the Blind Faith Price Target method? It is a way of taking the broad vision of Elon Musk or any company and using it a guage to just how much belief or disbelief the market puts into that vision. Obviously, the market does not believe this vision enough to discount it as it would a Treasury bond. That would be something like pure faith, and that would be dangerous. A great virtue of this approach is that it alerts us to times when too much faith is extended. When the implied discount gets to the extreme low end, watch out. Sentiment that is too bullish is simply not sustainable. So while the name is a bit tongue in cheek about Blind Faith, it actually is a tool meant to warn us against extending too much blind faith. Sure, FUDsters can twist this any way they like. They are willfully ignorant on a great number of things. But Blind Faith is a tool for measuring when there is too much faith and too little faith being put into a visionary company. A smart investor will want to discern the difference so that they can be greedy when others are fearful, and fearful when others are greedy.�
May 28, 2015
Quant There is no such thing as a blind faith price target! There is faith and a long term thesis where one looks at things from a macro standpoint and waits for things to play out over 5 or more years. And there are stock price targets which are not based on faith but some logical bottom up valuation methodology which may or may not be flawed in either the assumptions or the model methodology etc, or both.
An analogy would be science and faith/religion. You can't have blind faith science or science based religion! So, it is nonsensical.
So, I would submit that the subject or thread heading is illogical to the point where even Elon Musk would be say that is crazy nonsense!
Why let Elon down?�
May 28, 2015
eloder It's no different than using company guidance to set a stock price point in 12 months, only he's just going out 10 years off of expectations of Musk and his stated milestones/goals.�
May 28, 2015
jhm The easiest way to predict the future is to create the future. When Musk looks at Tesla he sees the potential to grow it 50% annually for over ten year. This is not a matter of predicting what Tesla will do. It is a matter of deciding what to do with Tesla. Will, intention and vision are matters of faith. What makes this blind is our inability to see clearly how will, intention and vision will manifest in concrete actions leading to fulfillment. Prior to April 30, how many of us knew that Tesla would market Powerpacks at $250/kWh? Without that information we were basically blind to what stationary market Tesla would address. We still have great difficulty anticipating how big this market may be. However, the problem is very different for Musk. He thinks about how much market Tesla wants to address, determines a suitable price to enter, and presses the organization to figure out how to achieve the required price target. So for Musk it is mostly a question of how to direct Tesla and that is an exercise in will, intention and vision. Investors may be the last to know how exactly Musk will lead this organization. You can build up whatever ground up model you like from whatever set of facts you may have on hand, but Musk has made it clear what his vision and intention are. Specifically, he intends to grow revenue 50% per year and realize a 10% profit margin in ten years. So the question for investors is to what degree do you believe that Tesla will make good on Musk's stated intentions. This is faith. It is trust in leadership. Certainly you can buttress your confidence with whatever facts you can call to mind, but at some point you will to believe or not to beileve those things you do not yet see. This is blind faith. Moreover the market is constantly changing its mind about what it believe and what it does not believe. Price targets are simply a guage on how much faith the market is extending or refusing to extend. Is it possible to quantify faith? Absolutely, because market prices are a function of sentiment. They always reflect the degree to which the market believes that Tesla will create shareholder value. So for me there is no contradiction between blind faith and price targets. One is simply the quantification of the other.�
May 28, 2015
vgrinshpun This is absolutely spot on.
And for for the doubters, just consider the future that Musk *created* with both Space X and Tesla Motors (Energy). These companies are a manifestation of his vision, leadership and skill. This is rock solid track record in making the future that nobody else could have envisioned, and absolute majority could not believe into once it was presented to them, a reality.
I think that the BFPT is an excellent tool in evaluating how the Market buys into the big picture presented by Musk.
Thank you, James for another excellent contribution to the Forum.�
May 29, 2015
jhm Thanks for reminding us of Musk's broader track record as a serial and parallel entrepreneur. I suspect that is Musk did not personally see the opportunity to grow at least 50% per year, he would not be interested in being CEO of Tesla. He's got so many opportunities to grow his wealth faster than that. He's not going to waste his time on lesser opportunities. This is something I've dubbed the "Musk Rate of Return" or MRR. MRR > 50%.
I've had recourse to MRR as way to develop a suitable long-term price target for SolarCity to develop BFPT for that stock. The MRR should apply to any Musk related company for which Musk takes an active role and holds significant interest. So it would be applicable to SpaceX and Hyperloop Technologies in addition to Tesla and SolarCity. It is significant that Musk sold PayPal. Does anyone follow that company close enough to know what its growth rate has been in recent years? My hypothesis is that it grows well below the MRR.�
May 29, 2015
Drax7 Totally agree with this view, and models like this can be dangerous if you actually believe
that reality will conform to them. Never let go of your common sense .
especially given the fact that markets can remain irrational longer than you can
stay solvent.�
May 29, 2015
SteveG3 James,
I read your post from last night, and very much appreciate your thorough response. I want to take your suggestion and reread the other posts you mentioned before I respond to the points we've been discussing. As it happens, I'm driving 500+ miles today... so I don't see myself getting to this today.
I do, however, just want to suggest that there's an alternative to talking about this in terms of faith, believers, and doubters... but rather in terms of confidence. Indeed, I think part of why there's so much appreciation for Elon Musk is the fact that he acts so untiringly with a sense that his actions can make a difference. One can call that sense confidence or faith. I'd go with confidence, as while Musk sees his actions making a difference, I think the scientist in him knows he does not "control" reality. You'll notice 1) he tends to discuss future events in terms of probability, 2) he's lived the reality of the Roadster, Model S, and Model X being late, and Space X blowing through it's three chances of success to luckily make it on a fourth chance from scraped together crumbs of capital, and 3) this very $700 billion market cap notion he introduced on the Q4 call, he immediately clarified was not guidance, (I believe what he said was ~<I'm not saying this would happen, but I bet that it will.> For me, "bet" echoes the notion of probability). Bottom line, I think Musk has the optimism of someone who believes he can collaborate with reality... neither "control" it, nor resign to "obey" it. That said, within Tesla, he may do a bit of pushing as if he expects "control" of reality from his engineers, as a performance tool similar to Jobs "reality distortion field," but even if he does, I'm confident he does not lose awareness that he's using a device he doesn't literally believe to be true.�
May 29, 2015
Citizen-T It's too late now to change the name. Blind Faith Price Target has entered the TMC lexicon and won't be easily supplanted.�
May 29, 2015
austinEV It's not unreasonable to model long term valuation. This is one such model, a very simple one. The name is sort of off-putting because it does sound like a worshipful thing, but the numbers behind it are not so different from what other Bulls have modeled. As models go, it has the advantage of simplicity, and because Musk specifically laid it out. And, as jhm points out, if you alter the projection a little bit it doesn't really matter. It would be healthier if a few other people started threads with *their* models along with this one, but they would agree more than disagree.
I think the opportunity is to just take this to it's logical conclusion, which I have done half-heartedly on my private model. Create a set of investing guidelines based on where the market is trading relative to this model or others. JHM's implied discount can be expanded. If you think about it, if these Bull models play out, in hindsight we will look at the chart and see a price that rises over time, but wanders around en route. Sometimes it will be towards the bottom of the channel (as it was 2 months ago) and sometimes it will be on the high side (as it was at the ATH). I suspect these prices will form something of a Gaussian curve with the median being somewhere in the middle of the implied channel. Where we could add value is by showing where we are on that Gaussian and say that if we are say 2 sigmas from median, we should trade accordingly, heavy in calls for 2-3 sigmas away from median on the low side and heavy on cash (or god forbid, puts) 2-3 sigmas away on the high side. Otherwise, whats the point of tracking these like this.
I am not whining for someone else to do this, I will if I get the time
(with all the heavy disclaimers about invest at your own risk, yada, yada)�
May 29, 2015
9837264723849 Say
1. Tesla manages to increase unit sales by 50% every year until 2025, as projected by Elon. This makes 3.17M units, almost as many as BMW's 1.81M and Daimler's 1.72M.
2. The average selling price is 53,000$, between BMW's 51,700$ and Daimler 54,400$. Tesla would then makes 168B $ in revenue in 2025.
3. Tesla manages to make 10% profit on this, far more than BMW (7.15%) and Daimler (8.02%).
Then, the market capitalization of the company would have to be 42x the company's earnings to reach the 700N $, as alluded by Elon.
Can Tesla actually:
- increase car production from 50K to 3.2M within 10 year? Tesla would have to make more than 6 times the output of the NUMMI factory when it was used by GM-Toyota.
- keep their prices very high, as they go down-market while averaging 20K $ above the Model III's 35K $ target
- make more money on each sale than their German counterparts
- and have the market value the company at 42x its earnings (while BMW is currently at 11x and Daimler 17x)?
Here's a uninformed guesstimate for the energy storage business:
Assuming that:
1. 5M households install PV panels on their roof in 2025
2. 50% of them purchase a 10 kwh battery, only made by Tesla
3. the Powerwall sells at 120$/kwh in 2025 (5% yearly decrease from an estimated 200$/kwh today).
This would make 15B $ of additional sales. If utility and commercial make the sames amount of storage each, at the same price, the total revenue from storage would rise to 44B $.
Using the 168B $ of sales from the automobile and 10% of EBIT, the stock would have to be valued 33x its earnings (21B) for the market cap to reach AAPL's 700B.
This still seems freaking high to me. What do you think of these hypotheses and of the line of reasoning?�
May 29, 2015
Lessmog Even more uninformed: I think you may have forgotten the industrial use of batteries, for companies and utilities. That part seems to have a bigger potential market than domestic. And there may be other, so far unknown, branches of business for Tesla, such as manufacturing GFs as a product. Elon Musk is one innovative, disruptive genious! I just can't be bothered to find my abacus this late ...�
May 29, 2015
jhm I would point out that Musk's 50% growth rate specifically applies to revenue, not unit sales. We need to stop thinking in terms of unit sale growth because this gets us sidetracked on issues like what the product mix will be. I dont think even Musk can anticipate what percentage of revenue in 2025 will come from autos. Until recently Musk thought that stationary storage would take about 30% of Gigafactory capacity, but now he's leaning toward 70%, which is why Gigafactory 1 could get 50% more capacity.
So if even Musk can't predict the revenue mix between autos and stationary out just a year or two, how can we have any hope of nailing down what 2025 will look like? This is the folly of trying to build a revenue stream from the ground up. Is all lost? Not at all, because building out an enterprise has full of great many opportunities and options. Suppose that the stationary business is able to double every year, while the auto business slugs along at 30% annual growth in revenue. 50% growth is still quite feasible simply by growing the stationary business bigger and faster. Or suppose autos steps upto 80% growth in revenue, while stationary moves at 20%. 50% annual grow is still obtainable by maxing out the auto opportunity. And there are yet other opportunities flying below the radar, such as the potential to build or tool Gigafactories for other companies, the Gigafactory as product concept. Software-as-a-service is another potential revenue stream some have floated. And there are many more. Remember that Tesla passed on Hyperloop, but if HT takes off with the concept, Tesla could design and manufacture tons of critical elements. The company has the talent to execute on any of this, but point is always to be focused on those opportunities that will yield the highest growth. Talent, opportunity and leadership will work it out. For a multi-entrepreneur like Musk, 50% growth is always doable, even if you don't know exactly what will work out the best.�
May 29, 2015
Lessmog And we haven't even touched on Elon's idea about electric jet planes yet ...�
May 30, 2015
adiggs electric boats, tractors, various sorts of utility vehicles (forklifts, actual golf carts, ..), panel/delivery vans, short haul trucks, fleet work vehicles, buses, ferry boats, ..
Transportation is an awful lot bigger than just cars, and some of those applications need an awfully big pile of batteries.
There's a lot of moving of stuff to be done and it is effectively all done by burning fossil fuels today, and needs to eventually be done with stored electrical energy. Lots of growth opportunities somewhere in those supply chains to tap into.�
May 30, 2015
9837264723849 Demand isn't infinite, Tesla might face some serious competition and Tesla will certainly remain production constrained for years.
EM can postulate a 50% yearly growth in revenue, but this has to translate in prices and volume that both demand and production can support.�
May 31, 2015
JRod0802 Out of curiosity, could you extend this table out (year by year) until the price hits $3739.82?�
Jun 2, 2015
SteveG3 Hi James. Had a chance to read those earlier BFPT posts last night.
Honestly, I got the impression, the BFPT kind of drifted from basically <hey, here's a little metric I came up with, let's see if playing with gets us to something useful> to <so what does my buy/sell indicator tell me to do>. That is, in your original post, I got the sense you were sharing something you were wondering if we might all find a way to evolve into something useful... but it just drifted to being used without examination and refinement.
Maybe I misinterpreted your message, but I got this impression from the very first thing you wrote about the BFPT,
"Sometimes super simple models can get you fairly reasonable results. I'd like to share a price model so simple it may just make you laugh, but let's see if it doesn't lead to something sensible."
I love your contributions here at TMC and I cheer your effort to come up with another tool to gauge the relative attractiveness of buying, selling, holding at the current market price. That said, having looked at the BFPT closely, in it's current form, it is not something I would include in my decisions re TSLA. Obviously, everyone makes their own call, but I did want to share my sense with anyone who might consider using the BFPT, including yourself, that a step kind of got skipped from conception to adoption of the BFPT in investing decisions.
�
Jun 2, 2015
JRod0802 As a disclaimer, for those who may have missed it and/or are new to the forum, here's another very long-term analysis of TSLA by our own DaveT:
Articles/megaposts by DaveT
Dave puts quite a bit of analysis behind this and shows how it might be possible to see a $2000 - $3000 TSLA share price by 2030.�
Jun 4, 2015
winfield100 I have a somewhat dumb question. I have a GTC (good till cancelled) order for 20-30% of my TSLA @ $5,000/share, to definately (hopefully keep the shares from being loaned to shorts. Is this a useless exercise? Do I misunderstand GTC (i've been in the market since 1977)�
Jun 5, 2015
austinEV Definitely the wrong thread for this question, but I think you need to ask your brokerage what the policy is. I recall this discussion making the rounds a year or so ago, and people were saying that a cash account they could not loan them out, and on a margin account they could? Of course you will never be affected either way, but I gather you are trying to increase the cost for shorters.�
Jun 5, 2015
Robert.Boston Yes, that's what I recall, too: unless you've used your TSLA as collateral for margin, or given explicit permission, your broker can't lend out your TSLA shares.�
Jun 5, 2015
jhm Thanks, Steve,
My thinking on this has definitely evolved, and not all of that may be expressed in posts. Part of the process is continuing to look at it over time and trying to figure out how it may be used. Certainly with any sort of trading tool, one wants to balance thinks out with a lot of other information and analysis. I constantly try to think about what does this tool capture and what might it be missing in this moment. That is actually one of the reasons why I like the simplicity so much. It's a simple enough tool that I can understand where the numbers are coming from and how that is not the whole story. Specifically, what the tool does is guage near term prices to the longterm vision. A basic tendency many of us have is to get so focused on near term issues and recent price movements that we miss any sort of long-term perspective. That nearsightedness tends to turn our investing into a trading game where we are constantly trying to figure out if the price is going up or down tomorrow. Personally, I do not think I can win at the trading game. Even so, the longterm prospects with Tesla are really promising, and the more I keep my eye on the longterm value creation, the less anxious I become about short term price fluctuations. Indeed, for a patient investor, having confidence to buy when the stock price is beaten down is extremely helpful. So in practice we'll see how this works. Right now we're just a little under neutral sentiment, so it seems to be a good time just to hold. If the price retreats back below $210 I may buy more, but it is good just to be content in this moment. No need to wish away the next ten years of my life.�
Jun 5, 2015
jhm Tracking long-term progress
I would like to recommend that the BFPT methodology is useful for more than just tracking stock prices. We can also use this framework to assess how Tesla needs to develop its capabilities to achieve its longterm goals. Particularly, we know that Tesla wants to reach $30.375B in revenue in 2019.
How do we know that? The basic plan is $6B revenue in 2015, growing 50% each year thereafter. That's $9B in 2016, $13.5B in 2017, $20.25B in 2018, leading to $30.375B in 2019.
So what capabilities are required to hit $30.375B in 4 years. The backbone to both the auto and stationary storage is Gigafactory capacity. Tesla generates nominally about $1000 revenue per kWh making cars. So if Tesla sold only cars in 2019, it would need 30.375 GWh of gigafactory capacity. By contrast, stationary generates nominally about $250 revenue per kWh. So the mix of auto and stationary sales determines how much revenue per kWh Tesla can make. 2/3 auto, 1/3 stationary generates about $750/kWh; hence, 40.5 GWh (30.375/0.75) is require. Under, this mix the Gigafactory can wait until 2020 to reach nameplate 50 GWh capacity. However, the recent view on stationary is that it may consume 2/3 of battery capacity, leaving 1/3 for auto. At this mix, Tesla generates $500/kWh, and a whopping 60.75 GWh capacity by 2019. If this path is pursued, there are two leading options: expand the Gigafactory to 75 GWh by 2020, or build Gigafactory 2 quickly enough to have about 12 GWh capacity in 2019. Quite possibly both paths need to be pursued for greater assurance of timely success and because Gigafactory 2 is absolutely needed by 2020.
So how does this help us as investors? We need to have clear expectation that Gigafactory 2 must start building within 3 years if the stationary business is to be pursued with gusto. Failure to set out a timely plan for this expansion would be a signal that Tesla is not prepared for the longterm growth envisioned in the BFPT. So we see that faith is not so blind. Concrete steps must be take to make the vision a reality. We can work backwards in this manner to derive other capabilities that must be developed in a timely manner. I'd encourage us to think through these issues.
Suddenly the Gigafactory does not look so big.�
Jun 8, 2015
SteveG3 James I can certainly see why looking at where TSLA's current price is relative to its 52 week high and lows has some value. I can also see where Elon Musk's pattern of sharing long-term quantitative descriptions of his vision of Tesla are extremely helpful, even in cases like the Apple market cap comment where he explicitly clarified that this was not guidance (indeed, it led to my raising my estimates in my model, and increasing my valuation of the shares, but not to my assuming the numbers Elon shared. In fact, I started a thread within days to analyze whether Elon's goals were possible, and discuss what it would take to reach them).
All that said, clearly you want to make your trading decisions on the best possible tools, and I think there's an alternative to addressing the shortcoming you described as a motive in your constructing the BFPT.
In your first post on the BFPT (#2400 in the Long Term thread) you wrote,
"It's a matter of fitting model parameters to market prices, something which fundamental analysts almost never do. But truly it is the market that determines the discount rate, and analysts are foolish to think they know better how the market values future earnings from any source."
I do some discounting in the tool I use, but I do not see that as having the shortcoming you suggest.
I'll give a brief summary of how I make my estimate of Tesla so you can see my discounting in context. Here's what I do:
1. Construct bear, bull, and base case volume scenarios and corresponding earnings for 2020 and 2025 (now mostly I focus on 2025 for updates, as 2020 doesn't move around nearly as much).
2. Assign a probability to each scenario.
3. Calculate a weighted average of my expected scenarios.
These steps above are my way of accounting for the unknown of level of Tesla's future success, so as I understand it, this is where an aspect of discounting, discounting for risk in Tesla's execution, resides in my method.
4. Discounting for time value of money/risk of my imperfect forecasting. Based on the size of my Tesla position, the alternative investment options I have, and my level of confidence in my estimating the probable future returns for both, I've decided that as long as I see Tesla returning 14% or better annually, I have no interest in reducing my core Tesla position.
This is a discounting based on the level of expected returns I find warranting the size of my position in Tesla. It has nothing to do with what other market participants have got right, wrong, or are ignoring (i.e. swing traders, those using TA, those just reacting to the latest headline, etc) about Tesla's likelihood of reaching their publicly stated goals.
5. Using that discount I can estimate what my model sees as current fair value.
6. When Tesla is 25-30% below my fair value number, I add on trading shares in increments. I've added trading shares many times, and used up nearly all the money I'd put into trading quite close to the lows from the "f*res" and the recent selloff this winter. If it got 25-30% above fair value, I would consider decreasing my core position (it got close to, but did not reach this level at it's $290 peak last year). Fwiw, I've used this a couple years, and shared it on TMC about two years ago.
James, I'd say the biggest singular influence on my investing has been Warren Buffett. Buffett's mentor, Benjamin Graham, said
�In the short run, the market is a voting machine but in the long run, it is a weighing machine.�
I think the tool I'm using is aimed at keeping a steady focus on the weighing machine's number, and merely seeing the voting machine as a potential opening ("Mr. Market" as Buffett would call it) to buy, sell, or hold trading or core shares. Using a weighing machine I've had very little concern over the past couple of years with Tesla's volatility, both when the stock got ahead of itself, and when it was oversold. In fact, on multiple occasions, big sell offs have led to very nice trading profits. In fact, I used this method quite effectively for years with the other individual stock in my lifetime that I took a large position in, one, whose volatility made TSLA look like a blue chip, and which over 8 years provided terrific returns on my core position.
I really think the best and only way to make investment decisions is based on the relative current disparity of the voting and weighing machine. If you agree with me about this, I'll leave it to you to evaluate whether the BFPT does this.�
Jun 11, 2015
jhm SolarCity: Long-Term Price Target
Many people have asked if I might develop BFPT for SolarCity. Indeed, I've done this for my own use but have been uncomfortable with just how to set the longterm target. So in this post I would like to set out my current thinking on a suitable LTPT and let people react to it and provide feed back.
Think the longterm value of SolarCity should be based on Gross Retained Value. GRV is the NPV of contracts SolarCity has with its customers, using a 6% discount. It is the single largest asset that SolarCity posseses, and it is an income producing asset. Even if SolarCity were to stop installing new systems today, this asset would produce inome for the next 30 years.
It is an enterprise value metric and includes finafinan leverage. There is an unleavened version, net retained value, which backs out cast to cover debt. I have debated in my own mind whether to use GRV or NRV. My inclination is to see financing being used primarily to accelerate grow, not as something intrinsic to the value that SolarCity is creating. Well off in the future when the business is throwing off cash faster than it needs to grow, then SolarCity may well use less leverage. Thus, over time, I think GRV will be more indicative of the value created for sharholders.
As of last quarter, SolarCity has 218k customers and $3,074M GRV. By mid 2018, they target 1 million customers, whence GRV should be $14,101M. Thereafter, I see the growth rate slowing from 90% to 50% for the next 7.5 years. This leads to GRV of $295B by the end of 2025. I also believe that the market cap could be at a ratio of 1 to GRV at that time. Presently, the market cap is $5.4B on $3B GRV.
I assume the number of share will grow about 5% per year, reaching 167.24M shares by 2025. Thus, my LTPT is $1764.13/share by 2025.
So there it is. Let me know what you think. If you're nice to me, I'll share the BFPT in another post.�
Jun 11, 2015
beeeerock Can you expand a little on your thinking regarding growth?�
Jun 11, 2015
atang James, thanks a bunch for taking the time and effort. Much appreciated! SCTY certainly is/and expected to continue growing YOY. When NY factory is operation with/ Silevo, it will grow faster! :smile:�
Jun 11, 2015
jhm Sure, I was in a hurry when I wrote that and did not have time to elaborate.
So over the 10 years global solar installation have grown at an annualized 47% rate. So as solar prices continue to reach and drop below parity prices with natural gas and coal, I expect this pace to continue. Utility solar has dominates this growth, but this has actually started to decline this last year. Meanwhile residential solar has grown 67%. The price gap between residential and utility solar is shrinking faster that utility solar cost. Thus, residential is catching up, but still has many opportunities to cut cost. Finally, SolarCity has demonstrated that it is quite competitive within the residential and commercial space. It stands to gain market share as the industry consolidates. It is also quite disciplined in cost reductions and targeting markets favorable for growth. They are perusing manufacturing their own high efficiency panels, which can cut cost and increase the capacity per installation. Including Powerwalls/packs can also increase the value per installation. Developing their microgrid service and providing other grid services from aggregated DERs provide other opportunities for long-term growth which are very hard to value at this time. So put altogether: solar is growing at 47%, residential may grow faster, and SolarCity will compete well through industry consolidation. So SolarCity should be able to hit it's million customer goal in three years and continue at a solid pace through 2025.
This is to be sure an optimistic outlook. Certainly any number of things could go wrong. This is why it is suitable for market participants to discount such an outlook. So at today's price of $55.46, the market is discounting this LTPT of $1764.13 at about 39% (= (1764.13/55.46)^(1/10.5) - 1).�
Jun 12, 2015
jhm SolarCity BFPT
So let's look at the BFPTs that follow from my LTPT of $ 1764.13 at the close of 2025. This again is based on a 50% growth rate past mid2018. Perhaps if I have the time I can work up a sensitivity analysis to this where we assume a 40% growth rate instead. But for now I think 50% is pretty good. It is the MRR, the Musk Rate of Return, the minimum revenue growth rate that keeps Elon personally invested in a company. He does own about 20% of SolarCity and could easily put that money into one of his other ventures if he thought the long term return would be greater.
I've include target for mid 2018 so that we can compare them with any other expectations we may have about hitting the million customer goal. Note that at this mid 2018 mark we expect $14.1B in GRV, this works out to $121.55 GRV/share assuming 116M shares. So how do we feel about median BFPT of $166 based on $121.55 of retained value? This is a price that is 1.36 times GRV. If this needs to be adjusted, we can adjust the assumed growth rate. Also note the spead from $143 to $222. Does this capture a reasonable range? If we think this range needs to be wider, we can push the LTPT date out further. This would increase the spread.
Percentile
Implied Discount
6/12/2015
1/15/2016
6/12/2016
1/20/2017
6/30/2018
13.63
38.63%
$56
$68
$78
$95
$152
0
39.73%
$52
$63
$72
$88
$143
25
37.92%
$59
$72
$82
$99
$156
50
37.03%
$63
$76
$87
$105
$166
75
33.58%
$83
$98
$111
$132
$201
100
31.80%
$96
$113
$126
$149
$222
So chew on these targets. If there is anything else we may anchor or compare this to, let me know.�
Jun 12, 2015
beeeerock Thanks for the details!
The way I read it, I infer that you don't think SolarCity would venture beyond the residential/commercial market space. Do you think they'd never move into utility scale installations? It would be a departure from their current model, but could be profitable if they were able to get some cheap desert land next to a gigafactory for instance...?�
Jun 12, 2015
jhm It's certainly possible, but I don't think it is a good fit for their capabilities. They've worked hard to remove the cost of rooftop installation both residential and commercial. For example, they acquired Zep a maker of solar brackets and hardware designed for efficient installation. Additionally, they are very capable in financing. These specializations are not necessarily optimized for utility scale installations. Of course, I suspect they could get those capabilities if they wanted to, so ultimately I think it comes down to strategic vision. I wild card for SolarCity is their interest in providing microgrid services. Here they essentially act as a utility in integrating distributed energy generation, storage and loads. So the vision seems to be that energy services can all be highly distributed, but also interconnected connected. So it's a very different vision of how energy is produced and distruted.
In my own reading, I have learned that typical utility power bill can be broken down to 58% generation, 31% transmission, and 11% distribution. Often the low cost of utility generation is compared with the relatively high cost of distributed generation. However, it is very expensive to deliver remotely produced power to the end user. Consider, residential power at say 12 c/kWh. This is fairly inexpensive, but the transmission and distribution expense is about 5 c/kWh. What happens as the cost of solar and batteries shrink toward 6 c/kWh? How will utility solar compete? Utility solar would have to be 1 c/kWh or less just to make up for the cost of delivering that power. Granted the use of batteries within the grid can help drive down T&D costs, but delivery cost remains. Moreover, many of those reductions in T&D will involve storing energy close to where it is consumed. Thus, even the grid becomes more decentralized. So if the grid is becoming more decentralized, as an entrepreneur you want to be receiving end of that trend. Recall at EEI Musk said he sees solar producing about half of the world's energy and that about a third will be distributed. My impression is that he sees about twice as much distributed solar as utility solar long term. Recently trends show that growth in utility may be declining while growth in distributed solar is advancing 67%. Thus, the trend may be shifting from predominantly utility to predominantly distributed solar. We'll have to keep watching to confirm this shift, but it stands to reason that this trend would continue as the gap between residential and utility installed cost declines. So bottom line, if SolarCity can secure a 50% market share of distributed energy and this ultimately 1/3 of all energy, then SolarCity stands to capture 1/6 of the energy market. That is a pretty huge opportunity. It's an opportunity to grow at about 50% annually for over 35 years. So I'm pretty excited to see how far they can get in the next 10 years.�
Jun 14, 2015
beeeerock True, this is an interesting part of the analysis that didn't jump to mind for me. The real question will be how much of the power required during the night or during poor solar times will be provided by batteries and how much from the old-school grid. If storage doesn't take off in a big way (I personally think it WILL take off!), then the grid will remain integral to maintaining adequate power at all locations on the grid.�
Jun 15, 2015
jhm Right, even if battery storage does not take off, I think the objective of the utilities should be to complement distributed solar and make best use of it in the grid. So distributed solar is particularly good for matching with air conditioning loads on warm sunny days. These are the times that require the greatest capacity of grid resources. For example, transmission losses increase with the square of the load, so distribute solar not only cover part of the load, but it avoids driving up the losses in transmission. So utility solar aids in generation at these times of peak loads, but it does not minimize the stress on transmission. So apart from government mandates, I don't really see the need for utility solar to compete with distributed solar. Just because it is cheap does not cut it for me, because utilities don't need to pay to install distributed solar. All they really need to do is have solar friendly policies and pay suitable feed in tariffs. The problem of course is that the business model for most utilities is based on owning generation assess and selling power from those assets. Within this business model, distributed solar is perceived as a threat to revenue. More enlightened utilities like NRG are actively installing and financing distributed solar. This is a sensible way to recognize the long term economics of transition to solar while making a relevant business out of transitioning to this future. Coordinating demand response is another way utilities can integrate distributed solar. So utilities that focus on working with and complementing distributed solar will be in the best position to profit through this transition.
The basic risk that the utilities must watch out for is building up too much generation capacity, and this includes utility solar. Costner that the levelized cost of gas peaking plants is between 18 and 23 c/kWh. Given Tesla's price for Powerpacks, these packs can charge at 9 c/kWh or below and sell back at 18 c/kWh at a profit. So Powerpacks matched with wind, solar or existing baseload capacity is sufficient to put peaking plants out of business. So under the assumption that Tesla and others will produce these batteries at or below this $250/kWh price, The grid already sits on massive generation assets that will be impaired over the next 10 years. Utilities do not have the luxury of thinking they can continue to base their business models on power generation. The change will come whether they are prepared for it or not. So the tough question they need to ask is which generation assets truly prepare them for this transition. They may experience a generator glut, and I do not see how utility solar would serve them well under that scenario. They would do much better to develop aggregated DER capabilities.�
Jun 15, 2015
beeeerock This is what I personally find extremely interesting. While everyone was oohing and aahing about the Powerwall, I was stuttering in excitement over the Powerpacks... THEY are the game-changer in my opinion, while the Powerwall is simply a nice whole-home UPS.
The politics of delaying the inevitable transition are fascinating to watch. Not just from the electrical utility companies, but more so the Oil and Gas guys. When the Saudi oil minister is quoted making comments about building a solar infrastructure, you know things are going to happen. And I suspect (hope) that it happens sooner and faster than most people expect. I find it quite incredible that so much pressure is being applied to the various pipeline projects across both Canada and the USA... billions that want to be spent, to ensure a last orgasmic squeeze of revenue from the oil fields. Imagine if that money was spent on solar/wind/tidal infrastructure instead. All of those will continue to earn revenue long after the last oil pipeline is mothballed. Short term gain is the name of the game, at any cost apparently.
Sorry, I've digressed! The reconfiguration of the grid is a problem we're only just beginning to appreciate I suspect. It will be interesting to see how that plays out, and what efficiencies are discovered along the way.�
Jun 15, 2015
Johan Agreed!
That's pretty deep actually. You'd think there was one thing the oil men loved more than oil: money. So why not skate where the puck is going to be? They've become emotionally attached to the oil and is ignoring the fact that it's the money and power that's important (if you're in to that kind of stuff), not the actual oil.�
Jun 16, 2015
beeeerock I think they believe they can make a play from where they're standing without needing to skate, and they are willing to gamble that they can still get to where the puck will be before the play is finally whistled dead.
Unfortunately, they're making us gamble along with them and the smarter ones among us realize you can't typically skate faster than the puck.�
Jun 16, 2015
jhm Yes, they are betting that governments will bail them out. First, they try to pass the cost on to ratepayers using their status as legal monopolies. But this won't work because you can't beat the economics of distributed solar on captive ratepayers. After the economic damage has been done, they'll turn to governments to cover their capital losses. So ultimately taxpayers will be forced to pay for the missteps and malinvestments of the utilities. Just think of all the retirees living off utility, oil and gas, and coal dividends. Retirees are going to bear the brunt of this mess, so political sympathy for bailouts will be irresistible for politicians.
This is why divestment now is so critical. If investors wait a few more years before divesting, the economic damage will be much more severe.�
Jun 16, 2015
c041v This quote, brought to you by Canada. :d
I must admit, I'm having a bit of trouble following all of the threads and discussions around Solar, but I'm very thankful to all of those lending insight into the discussion.
I am also a bit surprised that UBS (Sorry, merging the UBS link from STPM thread UBS lays out "dream solar scenario: 50% of global generation by 2050 : Renew Economy) is disputing the ability for Residential applications to actually help customers get off grid, especially considering this technology just came out and they are mapping a dream scenario.
I'm mostly basing this off jhm's explanation of Generation and Distrubution costs a couple pages back, which made perfect sense to me. The Powerwall/Pack may not be completely there in terms of off-grid capabilities, but it's only going to get better, while your house will always remain the same distance to a power plant.
Hopefully I've aggregated this into something coherent. I've only just gotten back into solar reading.�
Jun 17, 2015
jhm Getting back to BFPT, I'd like to point out that Tesla's price at $261 has crossed above the median sentiment price point of $256. I'll try to dona more complete update soon, but it is nice to note that we are headed into bullish territory, according to my BFPT methodology.
It will be interesting to see if this threshold means anything in terms of trading behavior or other overt expressions of sentiment. My totally subjective impression has been that from the time we passed from first quartile to median levels, bears have been pretty muted and have not attacked the price much. Passing through the quartile, bulls too have been fairly reserved in trading and sentiment. Now as we move into the third quartile, I wonder if well see much more overt bullishness with both aggressive price movements and hype. Some think institutional investors have loaded up, and now it is time to hype retail investors to get on board. The thing that would take us well into the fourth quartile is a lot of momentum. So the question for my methology is whether it can somehow mark where momentum gets going. Today's gain is certainly impressive and it built on a nice gain yesterday. Is this the beginning of new momentum? We'll have to keep watching to see how this plays out.
I should point out that my strong personal preference is that we not move into new ATH based on momentum. I'd rather not have take cover when the price gets too high above neutral sentiment. Retail longs get burned by hype and momentum. I'd rather not see that. But one thing I hope for in the BFPT is a little help to know when the stock price is getting to far ahead of the longterm vision.�
Jun 17, 2015
mdemetri Thanks for all your work on this. I am not sure I fully understand what you are doing but it appears that it is a simple linear regression model (and associated deviations from the linear model to predict quartiles) starting from a time point X to the 700b valuation Elon predicted in 2025. However, I am confused what time point X is and what the valuation of the company was at that time point. It seems to me that the slope of the line will be different depending on the time point that you start the regression. If at time point X the stock was undervalued (like a few months ago) versus over-valued (like at the ATH), the slope of the line would be different. While in the long run this will not make much of a difference, in the short term (next 6-12 months) this would generate significant differences in predicting sentiment and implied discount. Do I have this right or am I way off base?�
Jun 18, 2015
jhm It's not really linear regression. It takes the longterm price target at the endo for 2015 as a given and computed the growth rate from any recent price in past to this longterm price, and it does depend on the difference in dates from the historical price to the longterm price. We call this growth, implied discount, because it represents how much of a discout the market price is to the longterm price. I then take the last 12 months of historical implied discounts as a reference distribution. In particular, I often speak of different quantiles, like the quartiles and median. I can apply these quantiles to a specific point in time like today or 12 months from today to get what I call BFPT, blind faith price targets. So using current BFPT as I did above, I can relate the current price to the reference distribution on market sentiment. That is how I am able to say that the current price is just above median sentiment, representing a neutral price.
An essential difference with linear regression is that regression would attempt to estimate the rate of growth, slope, from historical prices. If you extrapolate the regression line out to 2025 you get some sort of forecast which likely is nowhere close to where Musk is taking this company. That is, recent trading history is a very poor predictor of longterm growth. Markets may be efficient, but they are not prescient. So with BFPT we take the longterm vision as a given and work backwards to see what sort of prices the market puts on that vision. The market tends to be bipolar alternating between extreme optimism and extreme pessimism. It is this cycling of sentiment that makes market prices a very unreliable basis for forecasting a price point out 10 years. And investors get caught up in the oscillations of mood. They keep changing their longterm view based on recent prices. This is why the BFPT is such a useful methodology, it is a yard stick that keeps the longterm clearly in sight a gauges market sentiment against that. It is a bit like a using the starry night sky to navigate a long voyage, or using fixed satellite GPS just to know where you are.�
Jun 18, 2015
Jackl1956 I've always been a fan of Eric Clapton, Ginger Baker, and Steve Winwood...........oops, showing my age?�
Jun 18, 2015
beeeerock Probably, but you're still funny in your old age! ;-)�
Jun 18, 2015
forumman83 Hey guys. I'm new to the board but am a shareholder in Tesla and have been active in the stock market for years.
Do you guys have any forward (i.e. 2020 - 2025) EPS and P/E "guesstimates"?
I've done some numbers myself and figure if Tesla can sell anywhere close to BMW's total of about 1.5-2 million cars per year (and why can't they? I think Tesla is a better company) then I figure Tesla could have revenues of at least $90 billion (BMW's projected 2016 revenues according to yahoo finance). With a 10% profit margin that brings NET earnings to $9 billion. Divide $9 billion in earnings by the estimated 150 million or so shares (adding some for the possibility of future dilution) gives an earnings per share of $60. Slap a 30 multiple on that and you're looking at an $1800 stock.
Of course, these number are arbitrary and fail to take into account many variables and other sources of income. But interesting nonetheless.
Anybody else have a thesis?�
Jun 18, 2015
jhm Welcome aboard! Read this thead from the beginning. BFPT is all about tracking progress from recent stock prices toward a long-term price target in 2025. Musk himself set out the basic trajectory of becoming a $700B market cap company by 2025.�
Jun 19, 2015
forumman83 Thanks. And, yes I've read the entire thread. Great analysis.
With a 700B market cap in 2025, what type of Earnings Per Share are we lookin' at?�
Jun 19, 2015
jhm Short-Term TSLA Price Movements - 2015 - Page 690
This link shows the longterm calculation. So following that we are looking at $34.6B in earning on 185M shares for $187 EPS.
Pretty impressive. Do you believe it?
For kicks, let's see if we can back into Gigafactory output, number of cars and GWh of stationary.
Auto assumptions. 70 kWh and $56k per vehicle, $800 revenue per kWh.
Stationary assumptions. Revenue now $300/kWh, declines 7% per year for 10 years leads to $145/kWh.
Product mix assumptions. Stationary uses 2/3 of battery supply. Thus combined revenue per kWh is $363.33.
Battery production. To get $346B revenue, 952 GWh of supply is required. So to go grow 50 GWh in 2018 to 1000 GWh in 2025, gigafactory capacity must grow at a rate of 45% per year.
Stationary sales. 635 GWh, revenue $92B. To get to this volume on a base of say 2 GWh in 2016, an annual growth rate of 53% is needed.
Auto sales. 317 GWh, 4.5 M vehicles, revenue $254B. To get to this unit sale volume from a base of 55k in 2015, unit sales need to grow 55.5% annually for the next 10 years.
So how do people feel about that growth plan? What assumptions would make better sense? Of course, any number of alternatives can be constructed so as to hit long-term revenue growth. If more cars are sold, then few GWh of supply is needed to hit revenue targets. The cool thing is we can scale the whole business and figure out how quickly capacity must be added. For example, at 500k vehicle capacity, the Fremont plant will suffice until 2020, but an additional 277k auto capacity will be need for 2021. Anyway, let me know what you all think.
BWT, did anyone catch the significance of the GWh capacity needed by 2025?�
Jun 20, 2015
forumman83 I like it but 4.5 million vehicles seems high just 10 years out. Although I won't rule it out as impossible if they keep doing what they're doing. Also, I don't know much about the stationary storage. I see great potential but hard for me to forecast any sort of future revenue/profitability. Either way, the future looks bright.
I was thinking more along the lines of 1 million vehicles by 2025, although that could be low.�
Jun 20, 2015
Johan It doesn't matter you know if it's 1 or 5 million vehicles, it's that there are very few that dare to think in those types in numbers but here at TMC we know so much about Tesla that we know they'll build a lot cars, at least 1 million in 2025. So with your crude numbers above (unforgiving margin for example that I absolutely think Tesla can keep above 20%) you came up with $1800 in the year 2025, with a P/E multiple of 30 whichs seems in line with a high growth company that keeps growing. This means if you understand Tesla well you can put a lowish bound on the stock price in 2025 of at least $1000/share undiluted. Upwards "sky is the limit".
You got it perfectly though forumman83 - go ahead and invest, welcome to the party") �
�
Jun 20, 2015
hummingbird Hi Everyone, I am new to this thread. I am currently not long or short the stock so please don't attack me either way.
I am very excited about what JB has been telling the world that they (Tesla and the industry) will get to $100 per kWh by 2020, which is only five years from now. At sub $100 per kWh, this world will begin to be completely transformed (fading out oil, gas, coal, and even nuclear, not to mention the transformation of world geopolitics as well).
Have you guys discussed how the competition will play out in the electric car industry to about 2025, 2030? Will Tesla always be limited to the premium segment of the EV market?
At $100 per kWh, cars such as the Nissan Leaf and VW e-Golf will have range of 200 miles at starting price of $20,000 before government subsidies. (Math: 60 kWh battery x $100 = $6,000 battery pack, good for 200 miles for cars like the LEAF)
Do you see Tesla ever addressing the low end of the market? (e.g. $20,000) or will Tesla always be a premium product? sort of like what Apple does?
Another question I had was which battery vendors are supplying who at the present time? I know LG Chem supplies the Chevy Volt and soon 2016 Nissan Leaf. Panasonic supplies Tesla and Toyota. Who supplies BMW, Mercedes, VW, etc.... Is there a article somewhere that summarizes these supplier relationships? Actually, which suppliers for which cars is what I am looking for. (Sorry, this is definitely a bit off topic)�
Jun 20, 2015
forumman83 Hi. Welcome to the thread.
Yes, obviously competition will catch on, eventually but I will take the stance that Tesla is similar to Apple when it comes to competition. Samsung, Blackberry, Sony, LG, etc all make smartphones too, but Apple makes all the money. Why? Because they run a tight and innovative ship that was built on the back of a visionary CEO (Steve Jobs). Tesla is the same.
Tesla is not just building the best car; they're building the best service. I personally have come to hate GM, Ford, Chrysler, BMW, Volkswagen, etc. Simply because I feel like I get abused every time I deal with them. I go to a "dealership" for instance and "bargain" with these scumbags and feel like I'm in Mexico trying to knock $500 off the price. Then, with all the moving parts in my ICE vehicle, something is always knocking or ticking or something is wrong. So I bring my car into a "stealership" and they tell me I need this and that and I never feel like they're being honest. They have abused, and subsequently lost, my trust.
Elon Musk, apparently, told his service department "don't ever make a profit on fixing cars..." This is going to feed into long-term loyalty with the brand. Speaking of brand, Tesla has probably the best one going. They're high-tech, innovative, have a great logo and don't do any cheesy advertising which cheapens them (unlike Ford, for instance). Also, direct-to-consumer sales takes out the middle-man, which I think we can all agree we strongly dislike. Go into a dealership and have someone follow you around trying desperately to make a sale. I'm an informed consumer, I know what I want please leave me alone.
For all these reasons, Tesla will succeed over the competition, IMHO.
Thoughts?
- - - Updated - - -
I thought Tesla's NET margin was closer to 10%? Please correct me if I'm wrong. If it's closer to 20% then my numbers are way off.�
Jun 20, 2015
Johan The net margin is negative.�
Jun 20, 2015
TD1 Elon alreay called it "Gigafactoy 1" so they must have a second in plan already, maybe it will be in china.�
Jun 20, 2015
forumman83 Yeah, it's negative now b/c of all the investing they are doing. But I'm wondering what kind of profit they make (%-wise) on the sale of a Model S. I was assuming a net profit of about 10% of sale price.�
Jun 20, 2015
Johan You can't take the investing of the equation. Well you can but then you get gross margin on every car sold which is around 25%�
Jun 20, 2015
forumman83
Good point.�
Jun 21, 2015
chickensevil Re: significance of GWh capacity.
If that number is right, they will need 20 Gigafactories by 2025 if they are going to hit those numbers. That is one thing that I think will slow things down. The cost of building these factories from nothing is going to be enormous. If we need to build 19 more at 5Bn a piece, you are talking 95Bn in capital. Only Apple has that kind of money right now, Lol. I know the business is ideally self sustaining such that they can keep building factories, but I don't think we will have that many ready by 2025.
The good news, if they sell more cars over stationary it should mean more cash. But if they are selling 4.5M cars by 2025 it is going to be interesting to watch the other companies tremble at that point for the unstoppable wave that is Tesla. Going to be a very interesting next 10 years!
Something else to chew on. If Fremont is the blueprint for other factories... And also needing the 19 additional Gigafactories... Consider how many jobs that is.
19 Gigafactories with 6500 jobs a piece is 125,000 good high paying jobs!
To hit 4.5M cars and I think they are employing about 7000 people at Fremont, with another 8 factories needed, that is 56,000 jobs. Tesla is about to raise their employment from ~13000 current to well over 200k by 2025 as well. That is an employee growth averaging around 40% each year. I wonder if the number of people available to fill those jobs are going to be there. We might run into a skilled worker shortage before we do a capital shortage... Hrmmm�
Jun 21, 2015
adiggs Or Tesla is going to get very good at acquiring auto plants and their workforce from other companies that are finding they lack demand to keep the plants and workers profitably employed, and get them incorporated into the Tesla culture and way of doing things.�
Jun 21, 2015
forumman83 I would be hesitant about taking ground-level ICE employees to come work at Tesla. I used to work with a bunch of former GM, Ford, Chrysler employees and they would tell me some of the stories about the culture in those plants. You have to remember, with the unions and whatnot, these employees were virtually untouchable. Coming into work drunk and high, getting doctors notes to skip weeks at a time, neglecting duties, etc. They had (and probably still have) a terrible management vs. employee culture.
I think the employees that work for Tesla now actually care about the success of the company. This is a valuable Tesla asset that won't show up on the books.�
Jun 22, 2015
bonaire They either have to care or put on a good show. Without Union "protection" they either will care or will be let-go. California is an "at will workplace state". You can be fired for no reason at all.�
Jun 22, 2015
chickensevil Um, you do realize that most all of the factory employees at Fremont are former GM/Nissan employees, all of them with long time experience working at a Union based factory. And if I am not mistaken NUMMI was unionized. This was and continues to be listed as a risk in their filings.�
Jun 22, 2015
ken830 Toyota�
Jun 22, 2015
adiggs Clearly, if Tesla is unable to integrate new employees into the Tesla culture, and they instead bring along the culture they are accustomed to, then that won't work (whatever the culture is). However, the people I'm thinking of also have experience and skills that are directly applicable to the manufacturing and assembly of automobiles (where me, for instance, have no skill or experience that is applicable to that work). That is valuable if you're looking at going from a few thousand to a few hundred thousand people doing that work. It saves an awful lot of in-house basic training - both the expense and the time, where the time is what's really valuable.�
Jun 22, 2015
chickensevil Thanks for the correction.�
Jun 23, 2015
forumman83 I'm just saying I wouldn't be hiring them en mass and they would be put through a rigorous hiring process. I feel like GM, Ford used to work on the old referral system hiring someone cuz their dad worked there.
If I was Tesla, I would keep my standards very, very high. I think GM, F, Chrysler failed to do this.�
Jul 3, 2015
JRod0802 jhm,
I tried to create a graph in Excel to map your numbers to a line, that way I could reference what the BFPT would show for any given day, for each of the implied discounts that you showed. I don't really know what "implied discount" means though, so I just tried to make the graph match your numbers. Is this approximately what your model shows, or did I screw something up? It seems weird to me that the lines converge near the end, so maybe it's not correct.
Also, what are your formulas?
Thanks!
 �
�
Jul 3, 2015
Krugerrand Source?�
Jul 3, 2015
chickensevil How about the latest 10-Q? (It has been in the "risks" section for as long as I can remember...)
Also there is the famous conversation that Elon had with his workforce about what would make them want to Unionize and the concenses was terrible management... To which Elon replied that he has a strict no ***hole policy. He was having this conversation with these employees because many of them came from their former jobs as line workers either at NUMMI or other auto factories.�
Jul 3, 2015
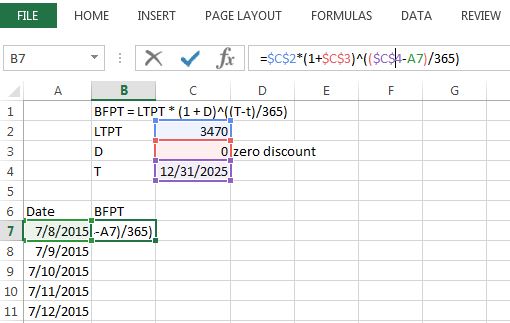
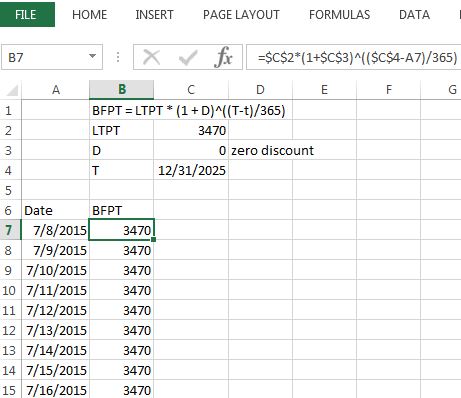
jhm This is the right sort of idea. All the curves converge to the longterm price target, LTPT = $3740 @ T = 2025-12-31. So given discount D, then the corresponding BFPT at time t in days is
BFPT = LTPT * (1 + D)^((T - t)/365).
So this is an exponential curve that passes through the LTPT.
Now the way we get a representive distribution of discounts is to use recent historical prices and solve for D. This is the idea of implied discount, the level of dicount to the LTPT that the market price implies. Where P(t) is the closing price on trading day t, the implied discount is
ID(t) =(LTPT/P(t))^(365/(T - t)) - 1.
So it is helpful compute and plot ID(t) for recent history. I routinely look at 2 or more years. This charts the swings in sentiment. As implied discount goes down it is a bull run, and when implied discount increases it is a bear run. It is easy to compute percentiles of the historical distribution. I use quartiles to set representative levels. One thing to contemplate as you look at look at a chart of historical implied discounts is how this distrubtion might change over time. The average discount presently is about 29%. Will this drift over time? In what direction? Yes it wiil change and will likely shrink over time. But the premise of the BFPT method is that this change in distribution will be quite slow, so that projecting out over just a few years is reasonable guage of variabikity in sentiment. Moreover, if the general trend is declining, this implies a bullish direction. Thus, the bias in this method is conservative for shareholders, that is, the method will likely understate future price distributions. I should point out, however, that this drift is very slow and the volatilty due to shifts in sentiment is so overwhelming as to make drift ignorable.
I hope this helps you explore this approach and am delighted that you are taking such an interest in it.�
Jul 3, 2015
Krugerrand Except that none of that confirms your words. There's absolutely no evidence that 'most' (or even half) of the current employees were former NUMMI employees.
Approximately 4700 people were employed at NUMMI. It closed early 2010. Tesla bought the factory shortly after the closure but didn't start making cars for two years. I'd think in that time frame that many of the former NUMMI people found other jobs. There'd be several not (initially) qualified to work for Tesla given it's an electric car. Tesla also does a whole lot more R&D than NUMMI ever did, meaning way more engineers hired that wouldn't have ever worked for NUMMI. Tesla also appears to do more parts making than NUMMI ever did and that requires tradesmen not generally available in a state like California. We also know that Tesla has gotten hundreds of employees from the likes of Apple, as well none of the upper management has any NUMMI connections - meaning they'd be likely to pull from other known places.�
Jul 4, 2015
smorgasbord Back at the Oct 2012 Beta drive event at the factory, I got the chance to stroll through the factory, talk with workers, and I even video taped a short interview with Elon.
All the workers at that time were former NUMMI employees. The buzz was that Tesla was hiring only the best workers, since they only needed something like 1/10 the workforce due to heavy robotics. The fellow running the sheet metal line was particularly memorable. He had worked that line for over a decade at NUMMI, was thrilled to be doing it agin, and was hoping his stock options would let him buy a Tesla himself in a few years.
Obviously, I don't know the percentage of factory workers that were former NUMMI workers, but I know from meeting them personally that the first batch were almost all former NUMMI workers.�
Jul 4, 2015
chickensevil I think this is what I was remembering. So even if the current employees aren't a majority NUMMI workers, I am willing to bet that at least half the employees were former auto workers in general, which means they were all unionized previously, which still goes to my comments about them coming from that environment of which the OP was commenting about how terrible those employees tend to be. The point of my counter was that if they were all so bad then why is that what Tesla has hired a large amount of.�
Jul 8, 2015
everman Thanks for this response. I also subscribe to the BFPT, and am interested in charting it. I am trying to work with the forumla you provided, but can't get it to do what I want. Could you provide the formula you use such that it could be plotted in excel? I am imagining rows with the date in it, and a formula that takes each date and inserts it into 't', with all other numbers in the calculation being provided as constants. Can you tell me what I'm doing wrong?
 �
�
Jul 8, 2015
Johan It makes a lot of sense when you paint that mathematical picture. What stands out to me is how though any and every information you can extract from such a curve is that it is 100% dependent on the price target (hence the Blind Faith Price Target). Change the price target and all the bear/bull/implied discount information get changed.�
Jul 20, 2015
jhm Everything looks correct. You will want to use a positive discount such as .285. You are using 0 discout which properly makes BFPT = LTPT. That is probably what is throwing you off.
BTW the LTPT I use is $3740. Of course, you can choose any value you want.
Good luck, jhm�
Jul 22, 2015
jhm Tesla BFPT Update
With all the crazy price movements lately, it seems to be a good time for a BFPT update to helps us keep our eyes on the long-term opportunity. It is curious that we were just pushing into the third quartile sentiment price of $287, but are push back to defending the median sentiment price at $266. Apparently the market is not ready to rush into fourth quartile bullish sentiment, but neither is it ready to really indulge in bearish sentiment either. This seems like a fair opportunity for long-term investors to buy at neutral sentiment prices.
On a technical note, I've expanded the training period of my BFPT from 12 months to 24 months. This dose not really change the median much, but expands the bearish tail a bit and gives the results a stronger historical footing with a little more conservatism around the downside potential.
I'd be curious to hear how different people might frame an exit strategy around these BFPTs. At what price point, do you want to take some money off the table?
Percentile
Implied Discount
7/22/2015
1/15/2016
7/22/2016
1/20/2017
0
32.82%
$193
$221
$256
$295
25
30.13%
$238
$271
$310
$354
50
28.76%
$266
$301
$343
$389
75
27.85%
$287
$323
$367
$415
100
25.47%
$349
$390
$438
$491
Best of luck, and as always make your own mistakes, not mine,
James�
Jul 22, 2015
austinEV I have been thinking about this quite a bit. That is, once you have a long term model (I have my own but I don't think it differs from BFPT materially) how does that translate into an investment? I had made myself this "holding table" which I have never followed:
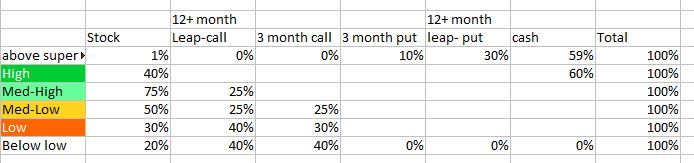
I don't like it and don't think it is right but the table illustrates what we need. I think the concept is right. Based on how the stock is trading vs your favorite model, force yourself to adjust your portfolio so you don't get caught holding calls when it is overbought and you remember to take some leverage when it is oversold. I was going to take a few different models and actually back test a few simple recommendations to see what works the best. Ideally you would do a monte carlo analysis and see how sensitive it is to random fluctuations. The ideal table is probably pretty moderate.�
Jul 22, 2015
jhm I see the logic of your chart. You're basically increasing leverage to the degree that the stock is underpriced. What you may be missing--and this could be why you are not following this plan--is momentum. What do you really want to do in the second quartile? Well that depends on if the stock has been falling from the third quartile to second or rising from the first to second. If falling in to second, you might prefer buying stocks to buying calls because this minimizes your downside risk should momentum proceeds down to the first quartile. Conversely when ascending from first to second, this may be an excellent time to prefer buying calls to buying more stock. Basically you have both momentum and reversion to mean sentiment working in your favor, so leverage is good.
So I had been thinking I would sell my J16 calls when crossing from third to fourth quartiles. I failed to do this two days ago, and my calls have lost about a third of their value. They're worth holding onto at current price, but had I sold them Monday, I would be buying shares today and locking in longterm holdings. Oh well. I hesitated because I thought we would reach a new ATH soon. I still hold that view, but I need to be more careful about using too much leverage going above median sentiment to a new ATH.�
Aug 21, 2015
jhm New Long-Term Price Target
It's time for a BFPT update, and with the recent stock offering it is time to update the LTPT as well. Specifically the old LTPT was based on 125M shares, which just prior to the secondary should hAve been 127.1M, but with the secondary we are now at 130.2M. Assuming 4% annual dilution for the next ten years put longterm shares at 192.73M. I am making no change to the 2025 market cap of $691,980M. Thus, the new LTPT stands at $3590.45, down from $3739.82. Does this dilution make much difference in near term BFPTs? Not really, the 12 month median sentiment BFPT is now $348.67, down from $350.94, a difference of $2.27. So if that makes a difference in your investment strategy, you should not mess with Tesla.
So the good news is that if you want to accumulate Tesla shares whenever we are in the most bearish quartile, this is your buying opportunity. The first quartile price level for today is $247, and in 12 months at this level of sentiment the BFPT is $320. Moreover, as noted, the median sentiment BFPT is $349. So if you're willing to hold a year or more, there really is a lot of upside potential. I try not to let all this angst about not hitting a new ATH in the next couple of weeks cloud my longterm outlet. In 12 months, Tesla should see $349, and if you're holding stock it does not matter when in the next 12 months we first get there.
So here are the new price targets. Good luck, everyone.
Sentiment Percentile
Implied Discount
8/21/2015
1/15/2016
8/21/2016
1/20/2017
1/15/2018
0
32.37%
$196
$219
$260
$292
$385
5
30.97%
$219
$244
$287
$321
$419
25
29.45%
$247
$274
$320
$356
$459
50
28.27%
$272
$300
$349
$387
$494
75
27.39%
$292
$322
$372
$411
$522
95
25.87%
$330
$362
$416
$456
$575
100
25.01%
$355
$388
$444
$487
$607
�
Aug 21, 2015
Gtoffo Hey JHM,
I'm trying to replicate your results but I'm having a hard time.
Using the 0 sentiment percentile the formula 3590�(1?0,32)^7 doesn't give me 219$.... what am I missing?
Also, how do you calculate the sentiment percentiles? We should create a shared spreadsheet.....
Right now I have this graph but the BFPTs are wrong....
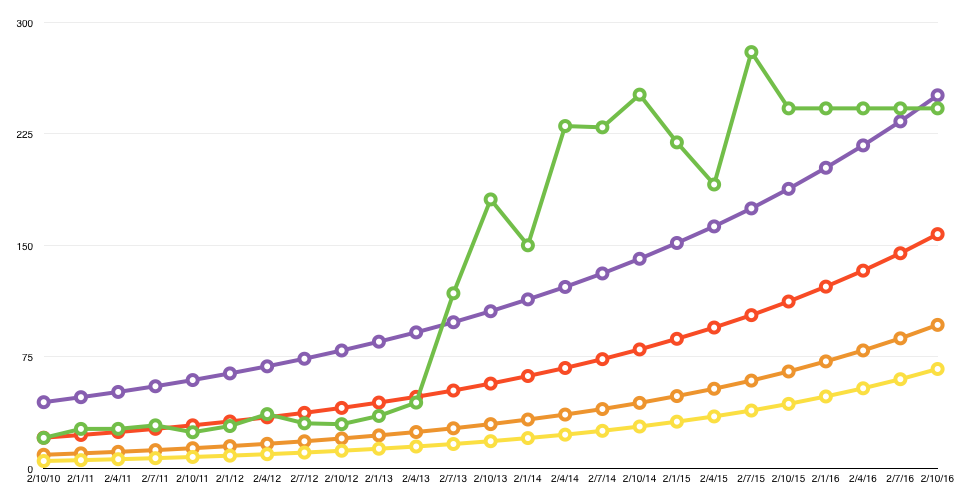 �
�
Aug 21, 2015
jhm Try this:
3,590.45�(1+0.3237)^(9.967)
=219.4179991095
The number of years from 1/15/2016 to 12/31/2025 is just a little less than 10. I count calendar days and divide by 365 to get years.
Good luck.�
Aug 26, 2015
jhm One little comment on the current price. $219 is current price level at 5%. The opportunity to buy at sentiment this low only comes around a dozen times in a year. I added the 5% level because I wanted people to appreciate the opportunity.
Reversion to mean sentiment is so fast that the median BFPT is realistic in 12 months. That target is $349. So buying today near $219 really does give us a fair shot at $349 in 12 months. That is 59% upside. With that kind of upside potential, I find the leverage of options unneeded. The beauty of buying shares is that you can hold them forever, but with options you run the risk of the expiration date being ill timed and forcing you to take a loss. So with 59% upside within a year, this is an incredible opportunity to own shares for a lifetime.
I'm sure I must sound like a pitchman, but the whole BFPT methodology was built just to identify these opportunities as they arise. So it's here, and I'm excited to share the moment.�
Aug 26, 2015
MikeC I'm with you. Great opportunity for long-term holders. Model X is around the freaking corner and the share price is where it was 18 months ago.�
Aug 26, 2015
jhm I do have the feeling that Tesla really grows in lumps. The Model S was a huge catalyst for growth and much of where the stock has gone over the last three years has just been the market digesting the potential of the Model S. So it expoded 3 years ago and has not really gone anywhere in the last 18 months. Tesla Energy is cool, but it has not yet really moved the stock, because sales of Powerpacks and Powerwalls have not yet moved the financials. So it is really important to own shares now before the Model X comes out because this will be the biggest driver of the stock for several years. I am hopeful that Tesla Energy will be a big hit by 2017. But the Model X really could be the biggest thing until Model 3, and most of those gains will be realized within the next 6 to 12 months.
So one of my own criticisms I'd level at my BFPT methology is that it assumes a very smooth value creation trajectory. It does not capture the lumpiness of how the business actually progresses. Someone building a detailed cash flow model can give expression to some non-linear growth dynamics, and so may be able to do a better job of navigating these near term events. But in defense of my super simple BFPT methology, it is transparent that it does not factor in these near term events. This gives us the ability to add our own commentary and mental adjustments to the simple trend. If we were actually above median sentiment right now, we'd have a hard time getting a solid buy signal out of this methodology. If we were at say $280, we'd be wresting with the idea that the median BFPT only shows a 25% upside to $349 in 12 month, but with the Model X coming out the upside is likely much greater than just 25%. Fortunately, we are spared that quandary by the fact that the stock is presently in quite bearish territory. The upside is big enough that we want to buy even if the Model X is not the second stage rocket engine. Frankly I have a hard time accounting for how we got so deep into bearish sentiment so quickly with all that is imminent. It may just be macro headwinds coupled with prelaunch jitters. Regardless, this is where the market puts us right now, and we can make what we like of this opportunity.�
Aug 27, 2015
Hogfighter The crux of this theory is that as each day ticks by, Tesla Motors is increasing in scale, scope, diversifying the product mix, and widening the competitive moat. Is Tesla Motors (the company) worth more today than last week? Of course...they are closer to Model X release, Tesla Energy product releases, GF expansion, to name only a few advances.
I for one have been happy to have had to opportunity to add to my portfolio with these prices. History will show whether we were correct (and rich) or incorrect (and broke).�
Aug 27, 2015
Gtoffo Well the formula I was using was wrong. But I should have realised that the multiplication didn't make any sense.
BTW I'm using the YEARFRAC formula to calculate precise year fractions (those 6th and 7th decimal points are CLEARLY crucial!)
Here is the new graph. I'm just missing the calculation about sentiment percentiles. I'm just using standard values that fit the top and bottom of the graph and then dividing up the interval. I can't come up with an easy way to do it properly. Do you have the algorithm posted somewhere?
I'm using quarterly intervals. So the latest drop isn't charted and the last 2 values are "random"
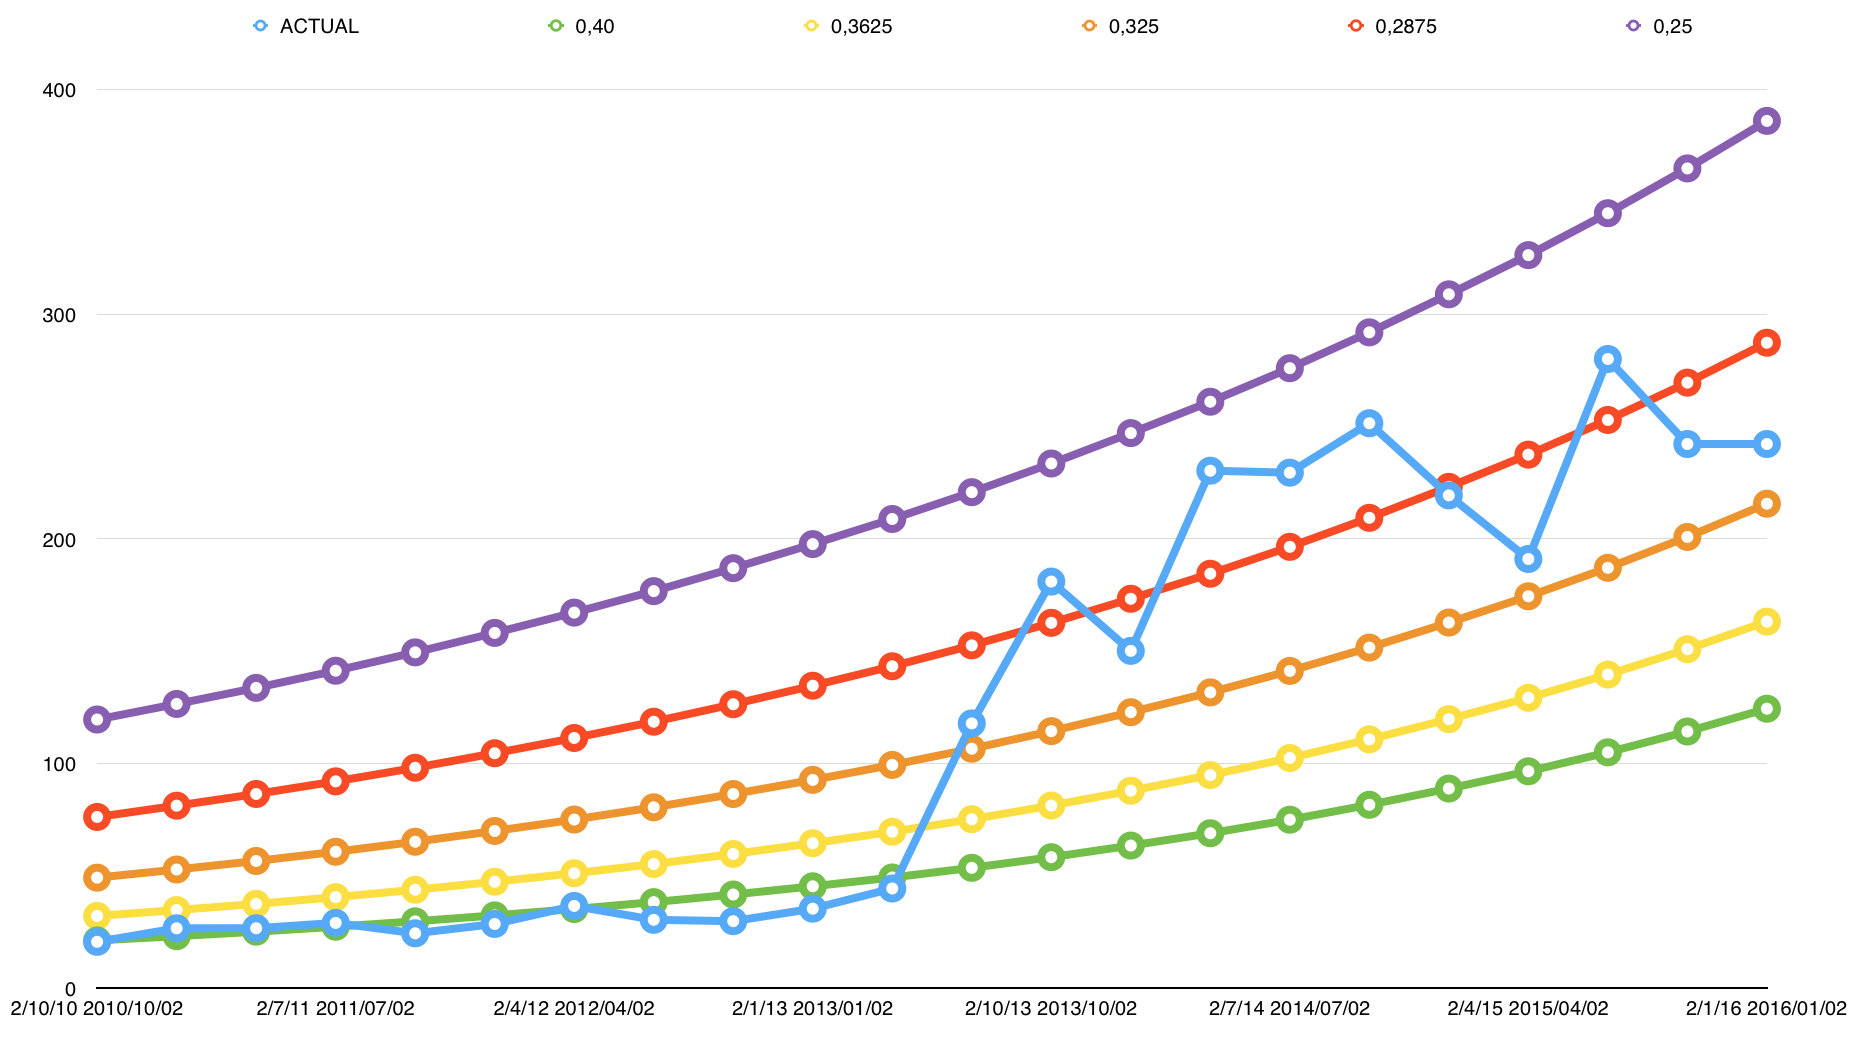 �
�
Aug 27, 2015
jhm Is the red line the median curve or 75th percentile? With quarterly prices we don't see all the daily volatility which the curves are trying to account for. You might try putting daily close prices on this or at least quarterly highs and lows.
I'd also point out that the curves are calibrated in the recent 24 months. If you plot prices be for that when the stock hovered around $30, those prices will look very low relative to the curves. My interpretation is that no one had the idea at that time that Tesla could become a $700B market cap company in 10 to 15 years. That sort of ambition was not considered until the Model S came out and changed everything.
Good luck.
Edit. Oh, I looked more closely at your chart and saw the legend. You're basing this on discounts. So the red one is the median, which looks about right. In the most recent quarter it should near $270, so this looks a little high. You might check that this curve passes through the latest current levels I posted.�
Aug 27, 2015
Cattledog Congratulations, nailed it.�
Aug 29, 2015
Gtoffo The idea was to have a long term overview of the methodology to understand how the stock moves to higher sentiment levels when some milestones are reached.
Big achievements reduce risk and consolidate the vision, therefore the discount rate should decrease in those cases.
I would caution short term traders not to put too much faith in this methodology however. Remember that those movements go both ways and there is no guarantee that when the stock is at a low sentiment level it isn't simply adjusting to a short/medium/long term downshift in sentiment. A week is an insufficient timeframe to determine if the buy signal from the method was correct.
This methodology should only be used by long terms stockholders I think.
With regards to the curves, I'm using the following formula: BFPT=LTPT/(1+D)^[(T-t)/365] and using the YEARFRAC formula to calculate precise year fractions. The red line correspond to the 0,2875 discount rate which is different from your median of 0,2827 (i've just divided in 4 the interval between 0,4 and 0,25....as I said, I'm not calculating percentiles as I can't come up with an easy way to do it, insight into your technique would be helpful).
Your analysis is based on the last 24 months..but what do you think is the appropriate discount rate for Tesla's LTPT today?
- - - Updated - - -
Switched to monthly data and added logarithmic version
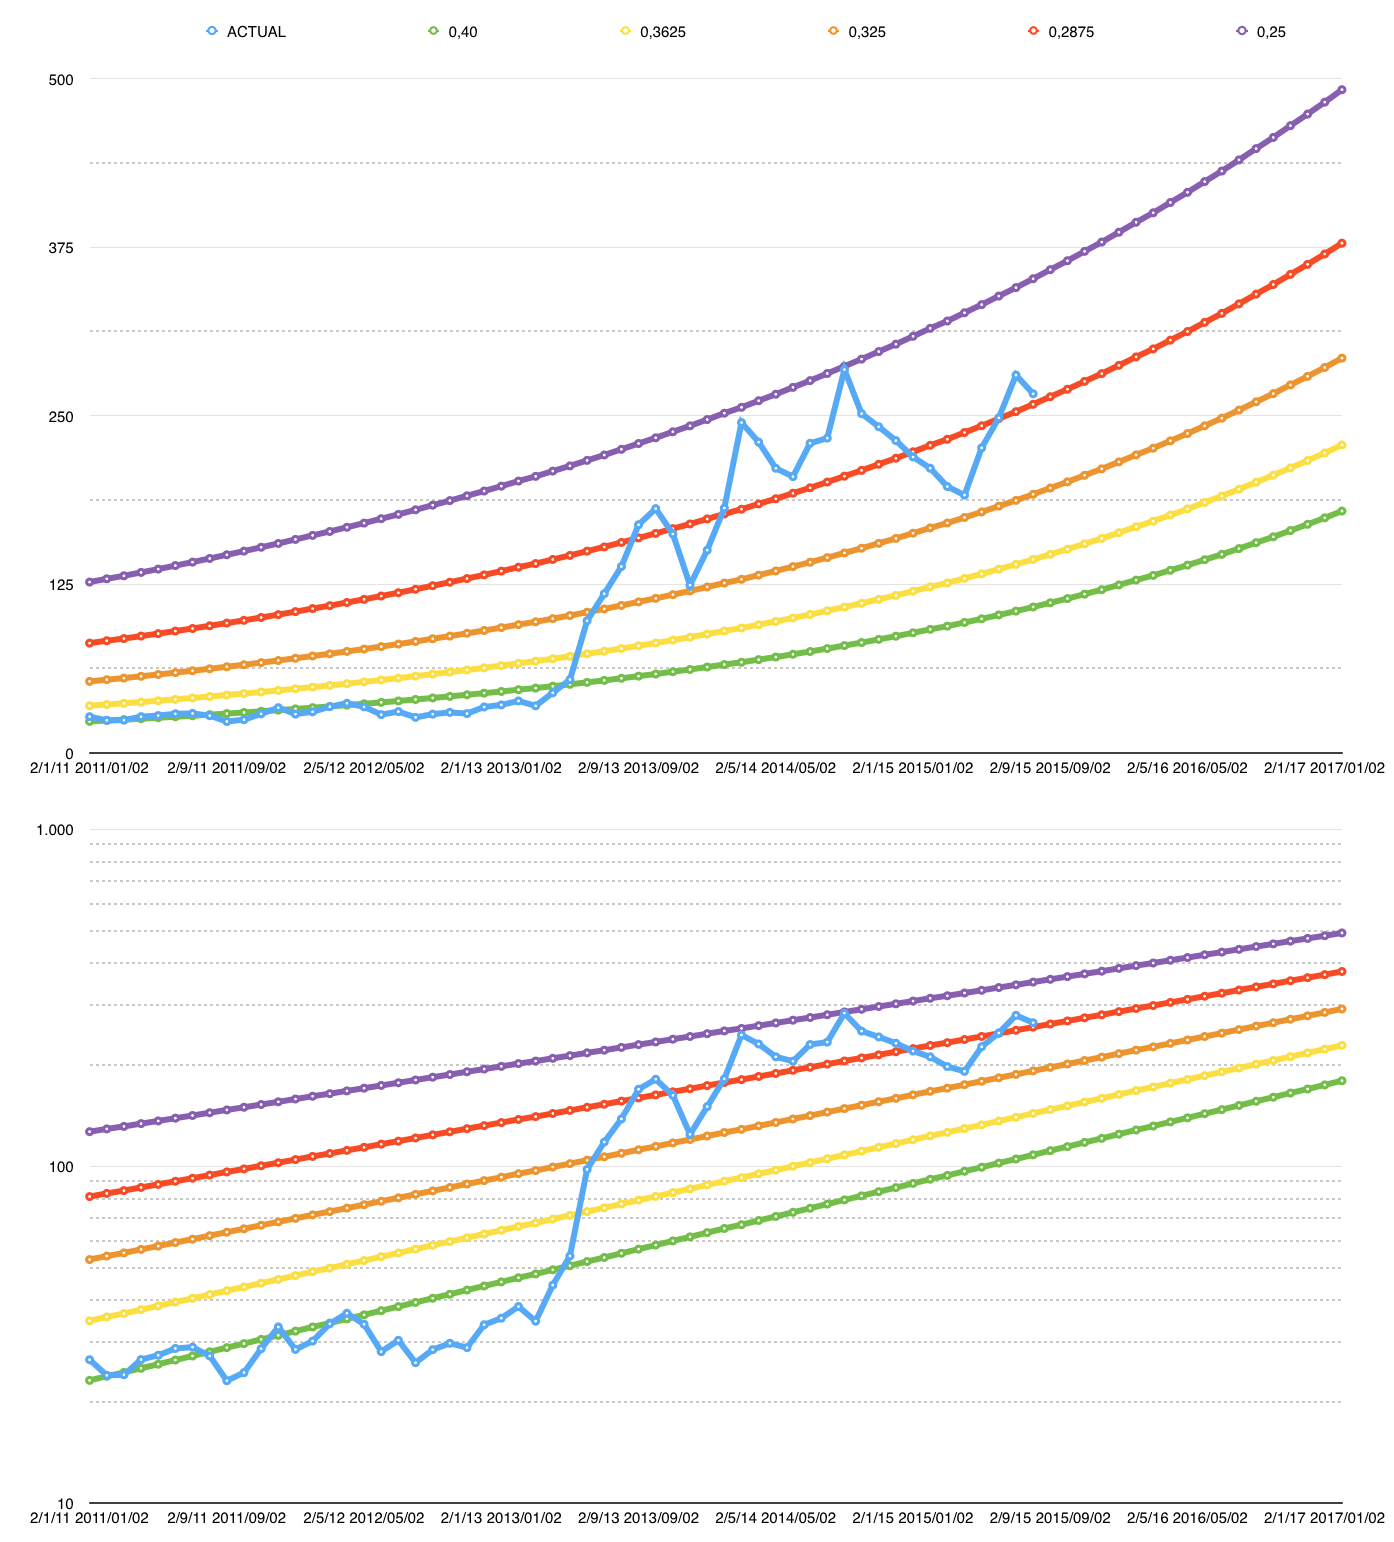 �
�
Aug 29, 2015
jhm Gtoffo,
The charts look great. The log scale is particularly helpful to see how these curves are constructed. They are actually straight lines in the log scale that converge at the LTPT. Thus, there is a contraction of volatility over time, and this is why it is important that the LTPT be well into the future, say 10 years or more.
I would second your caution about using this for short term trading. The point of buying when sentiment is really low is that you can lock in a really good price for a longterm investment. It is not any sort of signal for a near term reversal in prices. Short term price changes have almost nothing to do with the longterm value Tesla is building. So I use the BFPT methodology to see when current prices have lost meaningful connection with a longterm view.
I should also point out that I have done a regression of annual price changes on implied discounts. I did this as way to backtest the idea of buying at low sentiment (high implied discount) for a higher one-year return. So far what I have found is strong R-squared and that the expected return is roughly the return of the 12-month median sentiment BFPT to current price. Mean reversion seems to be fast enough for a 12 month time horizon. I would place a caveat here that we really do not have enough historical data for solid confirmation. But at least for now, I fail to detect anything that would invalidate this approach. It's always a good thing to test these things to make sure you are not doing something really stupid, even if you do not have enough data to prove you are doing something truly smart. That said, I am personally comfortable the 12-month median sentiment BFPT, so long as Tesla does not fundamentally change its growth trajectory.
If you want to compute quantiles of historical implied discounts, here is what you need. Get daily historical closing prices, say 24 months or so. For each historical closing price P_t on day t, compute implied discount,
ID_t = (LTPT / P_t)^(365/(T - t)) - 1.
Finally you can compute quantiles on the ID_t. In Excel, use the PERCENTILE function.
Additionally, for each daily historical price, I like to compute BFPT at that implied discount for various dates into the future. Then I can aggregate the targets any way I like, for example means and standard deviations. Quantiles of daily BFPTs are mathematically equivalent to BFPT of quantiles of implied discounts, which is one reason why I mostly work with quantiles.
Good luck implementing this for yourself. It really is the best way to really understand how this works and seeing potential for applications and improvements.�
Aug 29, 2015
Gtoffo Thanks, I'll implement it next. Although graphically it's already pretty easy to see where the sentiment is compared to the last few months.
I wonder if Model X deliveries will push the discount down significantly. That would support the thesis that the stock is about to bounce significantly....�
Aug 29, 2015
jhm Yeah, it's a big question in my mind whether the Model X will actually shift the distribution. Certainly we should see some movement into more bullish price curves, but will that stick? Will median sentiment move to a lower implied discount or go back to about 28.5%? We did see that sort of shift from pre-Model S to post. You can see that quite clearly in your chart. So it could happen again. We shall see.�
Aug 30, 2015
MitchJi Another point of view:
The BFPT timing model will apply equally well to timing LEAPS purchases. Two examples (missing the $219 opportunity) Friday Aug 28 close SP 248.48.
Code:Strike Last Bid Ask 180.00 90.00 87.70 91.50 68 of 90 (248 - 180) is intrinsic value 22 is time value, you pay a little less than 9% for 275% leverage 200.00 77.45 75.10 78.55 48 of 78 (248 - 200) is intrinsic value 30 is time value, you pay a little less than 12% for 317% leverageIf you roll those LEAPs 6-8 months before expiration, you will be paying less than half of the time values above (so under 6% for 317% leverage!), because the rate of time decay increases.
The worst case scenario is that TSLA is down for the entire 8 months before expiration (how likely is that?). That would cause a up to a 325% larger loss, but if you replaced the LEAPs with LEAPs at least you would pay a lower price for their replacements, and by the end of year two, assuming the increase is more than the first year loss you would be ahead.
NOTE: Trading in options definitely increases your risks. But the increased risk is pretty small compared to the potential upside. Using your estimate (a realistic 59% upside in 12 months) the potential upside is 310% (317% - 6%) x 59% profit is over 180%! This is not even taking into consideration that "when the stock price rises, the value of a call option goes up by more on a % basis".
Even if you roll the LEAPs into stock after one year, if the BFPT scenario works out you will come out way ahead!�
Aug 30, 2015
Robert.Boston I agree, MitchJi�while I have a core stock holding, I also use LEAPs to increase my leverage. Options are a good play for people who actively manage their portfolios; the investment of time is amply rewarded. They definitely required monitoring and maintenance.�
Aug 30, 2015
jhm I get your point. Unfortunately I am personally not so disciplined rolling my LEAPs forward in a timely way. So I probably should not trust my ability to handle the leverage. But others can make good use of both LEAPS and BFPT I wish them well. It is important to understand that BFPT is really oriented for multi year investments.�
Aug 31, 2015
Gtoffo How about avoiding the discipline aspect of plain LEAPS with bull call spreads?
One could sell a call at or above the BFPT and hold until expiry or roll at expiry.�
Sep 1, 2015
Robert.Boston Theta decay depends on the strike price, so you're still going to lose net value on that bull call spread as expiration date approaches.�
Sep 2, 2015
jhm Do you mean a covered call against my shares of stock? The tricky thing is waiting for opportunities when the stock price is well into bullish territory. A few months ago when the stock price was touching $280. I had noted that the price has passed above the 75th percentile. My thinking had been that I would start to sell off LEAP calls after crossing that threshold. Unfortunately, apart from BFPT thinking, I was also inclined to believe that we would see a new ATH before the bull run would break. So I was momentarily torn between longterm BFPT thinking and shortterm momentum thinking with the net result that I delayed action. The stock price soon fell fast enough that I missed that opportunity. At lower prices the LEAP look undervalued again relative to BFPT, so I still own those LEAPs, J16 and J17, and have even bought a few more J17. Had I rolled my J16s to J17 at nearly any point in time, I'd be in a more robust position for weathering bearish sentiment. So anyway that is the back story on my personal attempt to work with LEAPs, and I am a bit frustrated with myself that the holdkng options influences me to get a little to caught up with issues of momentum and timing than I'd like to be. So the basic wisdom of rolling forward to later date LEAPs is probably what I should focus on if I am going to hold calls at all.
Is there an optimal time to roll forward? Is there a way to coordinate that with BFTP metrics? Thanks.�
Sep 2, 2015
Johan There are two issues here, IMO.
1) To roll up according to which quartile the stock price is (i.e. bearish or bullish as compared with the longterm BFTP trajectory)? If you roll up in a bearish setting you're getting paid less for the call you're selling but also buying the new call cheaper, and vice versa if we are in bullish territory. Now since you're "rolling" you're likely rolling both "up" (in strike) and "out" (in time). I.e. you might for example sell a J17 $300 and buy a J18 $360 call. So the question becomes when is time value more expensive, relatively speaking? In bull times or bear times? My gut tells me it's in bearish times, which brings me to:
2) To roll when the i.v. is high or low? Sure, you could say that when the i.v. is high your getting paid more for your time value but you're also paying more for the time value of the call you're rolling up to (as per above). During bullish sentiment periods typically i.v. is relatively speaking high. And when the i.v. is low (which can occur during bearish times but also when the stock is trading sideways with little news and action for some time) you have the opposite situation: you get paid lower time value but time value is also cheaper when you're buying.
All in all I believe it doesn't matter that much if you roll when we're in bearish or bullish terriotry with regards to the BFPT but I believe it's smarter to roll when i.v. is low rather than high. My $0.02. Not backed up by a lot of empirical data.
One more addition: when rolling LEAPS the liquidity of the option can be very important, as low liquidity and a large spread can eat up a lot of "profit margin" so to speak. It's important to be diciplined and not sell one day and then sit and wait to buy, this is not rolling but trading. When you roll you have to sell and buy if not simultaneously at least the same day, and when you're doing that you need good liquidity in the option pair you're trading.�
Sep 2, 2015
hershey101 You can go here to get the equation for calculating derivative prices:
Black–Scholes model - Wikipedia, the free encyclopedia
Simply calculate the partial derivatives wrt time, vol, and px. and analyze how modifying these variables changes the price. This should give an intuition of how these curves behave, and tell you how far to roll and how much up to roll and when. I'll do it (and show my work�
Sep 2, 2015
Johan Thanks!
But I thought what we're discussing here are the nuances that are not captured by the traditional Black-Scholes model, that is how i.v. does not always change in a predictable pattern. Wikipedia says it more eloquently than I can:
if it weren't for this asymmetrical distribution when it comes to implied volatility there would be no need to time your rolling: just pick the desired leverage/risk and roll whenever. In reality there must be better or worse points in time to roll up, but finding these is not a straightforward calculation (if so it would be an obvious arbitrage situation quickly snapped up by the market).
One very obvious real world example of this is how the implied volatility often crushes right after a quarterly earnings call. In many ways, a strategy that is likely to often produce good results is to sell the call you want to roll just before the earnings report and then buy the new call (with a higher strike and later maturation- the one you're rolling up to) The day after the report. Only thing is that doing this is not really being disciplined in your rolling, in a sense you're gambling or betting on the earnings call. If the earning call causes a big move up you will have lost out on that upside move somewhat, but if the earning call doesn't result in a big move, or results in a downward move this timing will be very beneficial. The implied volatility crush phenomenon is of course less pronounced with LEAPS then it is with shorter-term options.�
Sep 2, 2015
jhm
Thanks! These are good considerations. I guess it would be ideal to roll when near term IV is lower than longer term IV. Perhaps the connection with BFPT is when sentiment is neutral. Remember how the stock price got stuck between 260 and 270 before it broke out to 280. The median sentiment price at the time was about 266. At median price longterm accumulators start to lose interest in buying, while short term momentum traders may step in if the think there is momentum. What we had was a lull where momentum traders were not stepping in. So I rather suspect that IV was declining as we traded sideways. Perhaps there was a short window when we first hit median price where the IV for shorter duration options would have been high while IV for longterm options would have been losing IV.
Even when IV is uniform across all durations, it still seems intuitive that a neutral market may be a sensible time to roll. One additional rationale here is that the market tends to revert to median or mean sentiment. When you buy in a bear sentiment market, this mean reversion works in your favor. But at bull sentiment prices it starts to work against buying. So it makes sense that you would want more leverage below median sentiment and less above it, so rolling out tends to reduce your leverage.
So suppose your strategy was to roll at the first moment the price hit median sentiment crossing from bearish to bullish. This could lend some insight into the choice of strikes. Basically when you roll you would want your the option you are selling to be near the money. This gives you the best liquidity when selling because they are most attractive to buyers. So with that in mind when buying LEAPs, you may want to select a strike near the median BFPT at the time when the next round of LEAPs will be issued. So if everything went according to plan, when the new LEAPs come out, the stock price is close to the median BFPT and your old strike and you roll immediately. However the timing of all this is not so likely, but you've got six months or so for the stock price to reach your strike just below median sentiment.
I think I could live with this sort of strategy. So I'd love to hear what others think of it or how it could be improved. Also, when do the J18 LEAPs come out? I can publish BFPTs for that date which would be relevant for selecting J17 strikes. Thanks in advance.
Edit...
LEAPS® & Cycles
If I read this correctly, TSLA is in cycle 3 which will list J18 on Nov 16, 2015. And the median BFPT at that date is $282.�
Sep 2, 2015
hershey101 I think you need to first isolate the difference between IV prediction, with the question of option price changes and price differential assuming all else is equal.
IV prediction (which is what you seem to imply we want to find) is hard. But as a general rule of thumb, IV goes up faster when going down then when going up... Eg. a 10% jump will inc IV less than a 10% drop... So now the question becomes, how does this IV change affect the option price. eg. if you want to move from JAN '16 to JAN '17, how does a 1pt inc. in IV affect two calls at the same strike... Then the question becomes, how does it affect two calls at different strikes...�
Sep 2, 2015
Gtoffo Not necessarily? First column is theta for calls. Even if theta of the strategy is negative....it's usually a small amount?

Also: if the value of the underlying moves up (assuming the lower leg was bought ATM) theta will gradually improve. So buying at the money and selling at the BFPT should be a good strategy?
Ideally one would keep the cash form selling the call so that if the stock tanks they would be able to buy the top leg back or double down maybe. That relieves some stress when trying to pull the trigger during big drops. Catching a short term knife can become profitable. Since the underlying trade thesis is based on a long term reasoning one can keep the long call for a while and wait for the short term negativity to subside (when that happens, sell again the top leg).�
Sep 2, 2015
jhm I'm interested in this strategy you're considering. The current stock price is about 242 and the BFPT for Nov, 16, 2016, when J18 are issued, is 282. So would you be contemplating a bull call spread from 240 to 280? If so, what would be your exit strategy? When stock hits 280, perhaps? Please walk us through this. Thanks.�
Sep 2, 2015
pz1975 In terms of when to roll LEAPS out, it is always better to roll them when the stock price is high. We did this calculation on here 1-1.5 years ago and it was quite simple to calculate (just pick 2 stock prices, say 240 and 280, and see what the options would cost at each price). Basically, you can buy more of the next year's LEAPS (2018) when selling the 2017 LEAPS when the stock price is high.�
Sep 2, 2015
Johan You're right - went back and looked at the posts in the TSLA Advanced options thread. Kenliles laid it out very nicely there.
So "all other things equal" it's better to roll when the stock price is high, i.e. in the upper quartiles of the BFPT distribution.
But what about volatility, which is a variable that is partly connected to sentiment (often iv will be higher during run-ups and bullish phases) but partly controlled by other things (higher before earnings announcements and other anticipation points in time, also rises when the stock moves sharply down)? Is it better to roll when i.v. is high or low (given a certain price)?�
Sep 2, 2015
pz1975 IV differences between different years' LEAPS (2017 and 2018) are likely to be minimal (tend to go up and down together); thus, the difference between their relative effect on when to roll out LEAPS is also likely to be minimal.�
Sep 2, 2015
Johan Thanks for your input. I had the idea that the the i.v. had a relatively bigger effect on OTM calls closer to expiry than those further out, but I guess this isn't backed by empirical evidence? But then again if there is such an effect perhaps it becomes balanced out by the fact that you also roll up in strike, and further OTM strikes may also be relatively more affected by higher volatility? In the LEAP rolling up scenario I'm thinking that you pick your new call strike in a way that makes it a 1:1 trade, i.e. for example you sell 10 Jan17 calls and buy 10 Jan18 calls, and pick the strike of the Jan18s depending on how much you got paid for the Jan17s you sold?
Anyway, too much rambling. Simple note to self: be disciplined, don't wait until later than 6 months before expiry unless stock is priced high in which case consider rolling up earlier.�
Sep 2, 2015
jhm Links to that discussion would be nice. Thanks.�
Sep 2, 2015
pz1975 Social Chat - Short Term TSLA Movements - Page 371�
Sep 3, 2015
Gtoffo Timing modifies the exit strategy a lot. Because in a vertical spread you have a fixed maximum profit let's call it MAXP which is the difference between the two strikes minus the net premium payed.
MAXP=STRIKEHIGH-STRIKELOW-NETPREMIUMPAID
I think ideally the exit strategy should be based on a % of MAXP (would like some input on this from others).
One should probably have 2 or more %MAXP targets for various "times to expiry".
An example could be: 50%MAXP if expiry is more than a year away. 70%MAXP if expiry is less than a year.
Example: If you buy a 240-280 spread and Tesla goes to the stars (let's say SP=400) at some point after, your spread will go up considerably but you might not be able to collect the whole MAXP (as the higher strike call will have a higher time value). The bottom leg is essentially almost stock while the top leg is now an ITM LEAP. You will now have a POSITIVE theta, as while time passes your spread will be worth MORE (the top leg loses value faster than the lower leg).
So wait until expiry or collect your winnings?
With the rules above we would look at expiry and depending on the time remaining we would check %MAXP vs our target. If a lot of time is remaining it makes sense to sell at a lower % as the capital will be freed up earlier and will be redeployed elsewhere. Also, the chances that we are now at an unsustainable sentiment level are high (unless a big shift has happened) so one should probably sell and wait for a pullback to redeploy.
What if the stock doesn't go to the stars but reaches the top leg in advance so SP=280.
In this scenario in most cases I don't think you would sell. Unless time to expiry is very short, your spread won't have achieved a high enough %MAXP so you would hold strong. As time passes your profits will increase. If the stock goes up you might reach your %MAXP. The stock would have to catastrophically tank for you to loose more. And if %MAXP wasn't at your target you probably still have a lot of time on your side.
What if the stock tanks at any time?
This is where the top leg comes in handy.
One other %MAXP should be set. And that is for the top leg. Let's say the stock has tanked and the top leg has lost over 50% of it's value (that's profit for you) and you still have a year to go. That's when it might be a good idea to buy back that leg and wait for a pull back. The protection you are receiving from that short call is now significantly reduced and you are probably at a very low sentiment level. If you believe you thesis is still correct: buy back the top leg and wait for recovery then SELL AGAIN YOUR LEG. Or you'll be exposed again.
Rinse and repeat if necessary. This is what might save you if you were wrong in the first place.
Of course, I'm trying to formalise a process which is pretty empirical in real life.
I've never actually set some fixed %MAXPs.....might do so from now on unless someone finds a hole in my reasoning.
Looking forward to comments.
Most of the values of the targets are up for discussion. As well as the value of the top leg (I usually always buy the bottom leg at the money). Should the top leg be [email�protected] sentiment? Or above or lower? The lower the leg....the faster a high %MAXP will be reached, less capital needed but more trading in and out required. Higher top leg means it's more of a fire and forget strategy but at a certain level the price of the call you are selling isn't really offering much protection.
Also, I'm not considering the roll scenario. Just best time to sell based on %MAXP. If you sell your spread and roll to the next leap you are still taking a slightly protective action, although you are probably still exposing yourself to some ruff times in the short term. The choice between pure sell and roll probably depends on time to expiry remaining. More time = sell, less time = roll.�
Sep 3, 2015
MitchJi Thank you! I thought more about our posts, and I now have a clearer understanding of what I wanted to convey. You said (paraphrasing) that now is such a good time to buy, with such a big upside, that it is not important to deal with options. IMO those are excellent reasons for using options. It is a relatively safe time to use options, and I think most of use would prefer to have leverage working for us, on our most profitable trades.
IMO that is a bad idea (please be very careful!). The tail wagging the dog. You know that more deeply ITM options are considered less risky. OTH those options have less leverage. So IMO when you choose strike prices you should be weighing those two factors.
I hope that by doing that your LEAPs will be so deeply in the money (huge profitable) that you do have less liquidity. Worst case (if you are in a rush) you end up with a $3-$5 bid-ask spread end up selling for the low end of the spread and lose the entire $5. But OTOH if you buy when ATM is about $250 for liquidity to be an issue ATM would be at least $350. If your LEAPs are ITM by about $100, I don't think that's a problem. It's time to celebrate! Plus, along the way, you can always roll your LEAPs into LEAPs with the same maturity and higher strike prices, which will allow you to either take out cash, or increase your number of LEAPs.
Please post a link to the relevant post or section of that thread.�
Không có nhận xét nào:
Đăng nhận xét