Oct 23, 2015
FredTMC I couldn't find this thread for Q4 so I'm creating it now
I posted a write up today about how Tesla can hit guidance for Q4 (16,800 cars in Q4 vs 11580 in Q3). 5308 more cars in Q4...
Short-Term TSLA Price Movements - 2015 - Page 1525
It's not as big as it seems since Tesla had over a week of production stoppage in Q3. That accounts for 1700 more cars in Q4 over Q3�
Oct 24, 2015
hobbes News on X production, sorry for crosspost:
If this is true, it means that a whole lot of cars must be in production already without the status for the customers updated. I guess that would be because it is still hard for Tesla to predict production time.�
Oct 24, 2015
MitchJi I don't understand what that means. Explanation please?�
Oct 24, 2015
blakegallagher I am guessing he means when a X enters production today it takes 6 weeks until it's ready to deliver. As they fine tune the production line for the X this will come down substantially.�
Oct 25, 2015
MitchJi That's what it sounded like to me too, but 6 weeks down to 4 weeks. That sounds like building them by hand! Can that possibly make any sense (I hope not!)?
�
Oct 26, 2015
uselesslogin So who thinks a guidance miss is priced in by now? The Model X delivery specialists have repeated to all Signature holders that it is their *goal* to deliver all Signatures by the end of the year. I will be shocked if they ship any significant quantity of production vehicles which means we are looking at 1,000 Model X only this year. Now reaching 49,000 Model S deliveries to make the 50k total guidance seems very challenging and I would think few investors think that will be easy at this point. I would be very happy to see 47,000 Model S deliveries which would continue the 50% annual growth narrative. I would also still be happy for the stock price to suffer for this since 2016 is filled with things like positive cash flow, Gigafactory production, Model 3 reservations, and Model X volume production. To be able to have one more opportunity to grow my position would be great.�
Oct 26, 2015
schonelucht The highest VIN reported on the forums is 683 with 15 or so samples including some of the later signatures. Statistically this means the highest VIN is going to be in the 700s. The rest has most likely deferred or cancelled. I think Tesla Motors is aiming to deliver those 700 cars still this year, but it's not going to be easy. 4 weeks after the 'full reveal' only an additional 3 or 4 cars have been delivered. No one has a status update on 'the factory is building your vehicle'. Clearly, the robot production line is not yet up and running. Unless Bonnie comes out with a delivery date, I think all the delivery dates communicated to later signature holders are overenthusiastic delivery specialists rather than a clear outlook on where production is at.
So here is my take on it : 700 signature model X delivered by 31st of December, if everything goes well. For good measure, I anticipate 13000 model S's delivered as well.�
Oct 26, 2015
electracity The risk for 2016 may be the rate of growth for the model S slowing. The U.S. has been cherry picked for the locations producing good sales volume per store. Europe and China aren't successful sales operations yet.
Going forward I'm unsure if selling S/X becomes harder or easier. I'm not sure if customer acquisition costs go up or down.�
Oct 26, 2015
uselesslogin Model S growth rate can stagnate for 2016 and the Model X demand/production would push Tesla to positive cash flow and then the batteries are gravy.�
Oct 26, 2015
FredTMC Article about biodefense mode will help Tesla sell in China (smog defense)
Tesla's most absurd sounding feature will actually help it sell a ton of cars in China - Yahoo Finance
Fleet Sales for Q4:
Something I don't think that has been addressed yet for Q4 is fleet sales. It's possible the tesla will do more fleet sales once consumer demand becomes a constraint. There's already a Vegas based company that is taking 125 Tesla's. Other opportunities include Uber, Google, city, law enforcement, limos, rental car companies other private company fleet sales.
I imagine tesla will will annouce more fleet sale deals in future quarters. It's sort of their way of hitting guidance if there's a gap�
Oct 26, 2015
StapleGun I see no reason why Uber or Google would be ordering fleets of Teslas right now. Neither of them own cars outside of their autonomous vehicle research fleets and I don't know why a Tesla would be a good choice for that. Law-enforcement tends to prefer cars with proven track records of reliability and durability, and even though they might have a lower TCO, a $70,000 car would cause budget concerns. I don't see a big advantage for rental car companies since they don't pay for fuel costs anyways.
If the Model 3 arrives as promised it will be a game-changer for any company that operates a fleet of vehicles and pays for it's own fuel. I don't know why anyone driving a Taxi (or an Uber) would consider any other new vehicle. But for now, the large up-front cost of the Model S is keeping a lot of that demand at bay.�
Oct 26, 2015
electracity Fleet cars are low profit too. Fleet sales are sometimes used to meet the volume demand of union contracts. The auto company doesn't make much money on the sale, but the production adds many hours for hourly workers.
A fleet sales on the mod 3 would likely be for basic cars. The margin on low end model 3 in the first couples of years is probably small to nonexistent. Tesla will want to design a base Model 3 that can compete fully featured in the $50-70K space. That base car will likely be more expensive to manufacture compared to cars like the Bolt. The Bolt likely looks like it does so that Chevy can always undercut Tesla on the low end of the Model 3. Upcoming cars like the i5 and Volvo will be designed to compete with Tesla in the midrange.�
Oct 28, 2015
Auzie Estimates of Model S VIN delivery numbers, required to hit 2015 delivery targets
Working backwards, if Tesla aspires to achieve 52500 delivery of Model S in 2015, then q4 delivery needs to be 19,343 cars.
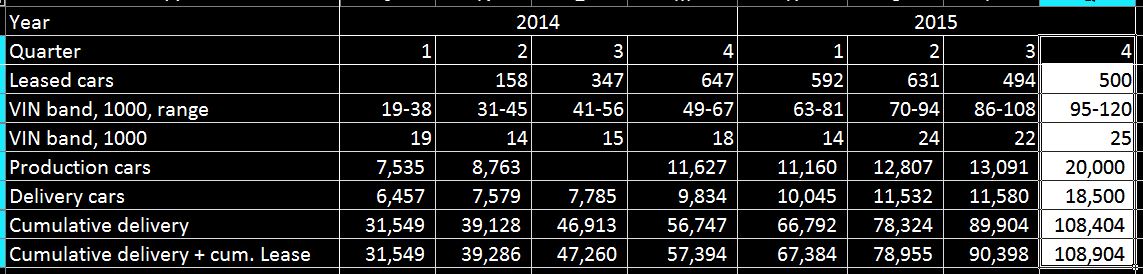
Assuming that happens, this is what we have so far, Model S only:
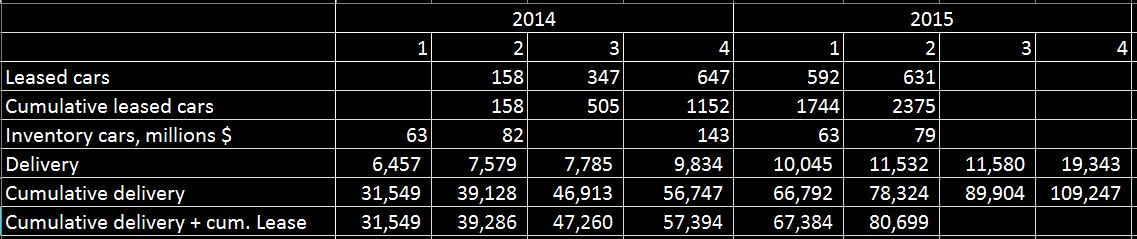
Delivery, leased cars and inventory numbers are from Tesla quarterly reports, with the exception of 2015 q4 delivery of 19,343. That is the required delivery number to achieve 52,500 Model S delivered in 2015. Cumulative numbers are not reported in quarterly reports.
The table shows 2014 and 2015 quarterly numbers for:
1. Leased cars
2. Inventory cars (transit, stores) in millions $.
3. Delivered cars to customers
Cumulative leased cars + cumulative delivered cars + the last quarter inventory cars = Total cars produced and delivered = The highest delivered VIN number
Note: I could not identify leased cars numbers in quarterly reports prior to q2 2014. I assume Tesla started leasing in q2 2014. If the leasing started earlier, the numbers of leased cars that I missed would be negligible. If there is an error due to that, it would be in the order of 100 cars or thereabout.
After q4, the table might look something like the below:
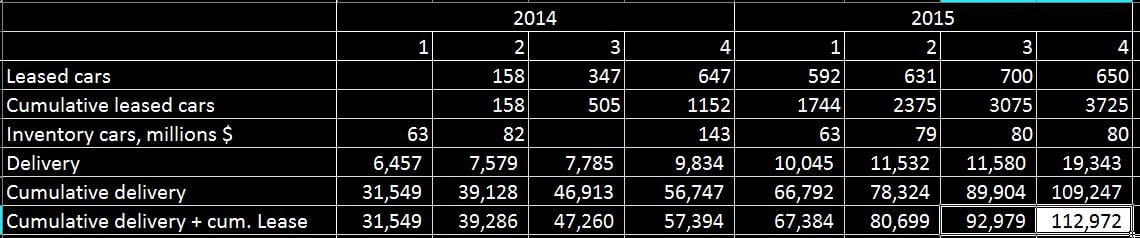
Assumption: no. of leased cars in q3 is 700 and in q4 is 650, and the inventory is 800 cars each quarter. These assumptions are in line with the historic performance.
Tesla needs to hit (deliver) VIN as follows:
112972 (cumulative lease and delivery) + 800 (inventory in q4) = 113772.
Any increase in the number of leased cars and in the inventory cars needs to translate into correspondingly higher delivered VIN number
There are a few assumptions above that may be incorrect, introducing error one way or the other.
Assumptions:
Inventory in q4 = 800 cars (could be higher)
Leased cars in q3 and q4 = 700 + 650 = 1350 (could be higher)
Sequential delivery of VINs
Let's say Tesla needs to be pushing out VINs in 114000+ before the end of 2015, to be on the safe side.
Model X seems unlikely to contribute much to the yearly delivery target.�
Oct 28, 2015
Gerardf Interesting ...
Not sure that indeed accounts for everything (loaners / demo's etc).
Anyway, in the Model-S delivery thread I found this posted yesterday :
Model S Delivery Update - Page 831
New S70 was confirmed on 10/21. Vin number is 113873. Heard from the delivery specialist today that the car is scheduled to go into Production in Mid-December. What I don't understand: Per the delivery spreadsheet, VINs up to 111870 are currently in Production.
At a rate of 1,000 cars/week, my car should be in Production during mid November. Is the DS incorrect with a better date to come in the future, or do things sometimes get this much "out of order"?
Of course, Tesla will have to be able to get that car produced as well as shipped to the customer. We all remember last years end-of-year delivery issues.
The car refered to here is from a buyer in CA. Could very well be why his production started later than he expected comparing to other VIN's.
�
Oct 28, 2015
Auzie Loaners and demos should be reported as finished goods inventory.
Tesla might scrumble VINs a bit, but only upwards, not downwards, ie we might see artificially high VINs assigned to people.
Tesla also handles CPO cars at an increasing rate, not sure how these cars will be reported.�
Oct 28, 2015
MikeC Great post, Auzie. I like that you are going for 52,500 and not 50,000 - which I think many bulls would be happy with given the current sentiment.
For the record, leasing was first announced in April 2013, I think it was part of the 5-part trilogy: Tesla Announces Model S Leasing From $500/Month* - But Not Really (Video With CEO) | Inside EVs
And business leasing seems to have been announced April 2014: Tesla's new $408 per month business lease deal for Model S reminds us of last 'revolutionay' deal�
Oct 28, 2015
esk8mw If you are looking for another vin data point, I just confirmed an order for a 90d with a vin of 114390. December delivery. I'm assuming the vin everyone quotes is just the last six digits of the number under the picture of the car on the my tesla page right?�
Oct 28, 2015
FredTMC Yes. Nice!�
Oct 28, 2015
esk8mw Can we really read anything definitive into the vins? Has anyone successfully drawn any conclusions in past quarters studying vins? I'm sure similar analysis has been attempted in the past. I've exited all my options positions prior to earnings but I could be persuaded to get back in...�
Oct 28, 2015
MikeC VIN counting was effective during the early Model S days, but after a lot of people got burned on a bad ER, the general consensus was that the method was not accurate enough anymore. Still, I'd like to see some members see if they can find any flaws in Auzie's logic here.�
Oct 29, 2015
Auzie Thanks, Mike. If business leasing was announced in April 2014, that aligns with the leased cars being reported for the first time in q2 2014.
Thanks for the data point.
It is possible that some higher VINs get delivered before some lower VINs get delivered.
VINs can get scrambled for various reasons: cars batching in production, shipment schedules to various destinations, preference given to some models, etc. Such scrambling would imply that the delivered number of cars is lower than the highest VIN delivered, as there might be some lower VINs that get delivered later for various reasons.
Having said that, if there is no single VIN reported in the 114000+ that means that the delivered quarterly number will fall shorter than my estimates above. The appearance of your VIN does not guarantee my estimated deliveries, but it allows the possibility of hitting the estimated targets.
It would be interesting to establish if these incorrect past estimations correspond to Tesla's expansion offshore and the scrambled VINs due to shipments schedules. I was not really following the deliveries based on VIN estimations in the past so I am not able to correlate the past estimates to the possible events that caused the estimation errors.
It might be impossible to get accurate calculations/predictions of quarterly deliveries based on reported VINs due to VIN scrambling, as I stated above. As the number of delivered cars/quarter increase, the VIN scrambling effect is likely to play a relatively smaller role and the delivery estimation error might become smaller. Variation of several hundred or even few thousand cars is introducing relatively smaller error when Tesla starts delivering tens of thousand cars/quarter.
I also expect the inventory cars to go up in proportion (not linear though) to rising deliveries from quarter to quarter. More cars are needed for more stores, service centers and to fill the larger transit pipeline.
It would be helpful to try to estimate the VIN band - the difference between the highest delivered VIN and the lowest not delivered VIN in a quarter. The size of that band might help estimate the size of the delivery prediction error.
Or am I going insane with this, not sure �
�
Oct 29, 2015
Quant Recently ( in the last 2 weeks ) . Elon Musk was quoted as saying current production rate was about 1,200 a week . So, I'm not sure your numbers and expectations jive with current production rates.
Sorry, I don't have the quote in the interview handy....�
Oct 29, 2015
mrdoubleb Just a word of caution: we have discussed several times how VINs are no longer a good method to predict delivery/sales as Tesla has taken precautions against what you are doing nine this analysis. As far as I know VINs are no longer strictly sequential and do not correlate to production order. Also, Tesla may be skipping VINs, so just because you se No. 114,000 issued, it does not mean 114k have been misused, they may have skipped a few thousand numbers.
I am by no means an expert on VIN, so you may be a step ahead of my understanding of this, just wanted to make sure you are aware of some of the difficulties of predicting sales by VIN.�
Oct 29, 2015
esk8mw I should also mention that I was quoted December delivery when I ordered the car - I do not yet have a firm December delivery date. Another post in the Model S forum indicates that delivery dates are being pushed back for some people so it's entirely possible that my 114 VIN will not be delivered in 2015 - I haven't heard either way yet.�
Oct 29, 2015
hobbes No, you�re not! Just thinking a bit farther than everyone else. I like the idea of the VIN band. The hard question is as always with those approaches: how to get the data?! Is the anecdotal data points from posts enough?�
Oct 29, 2015
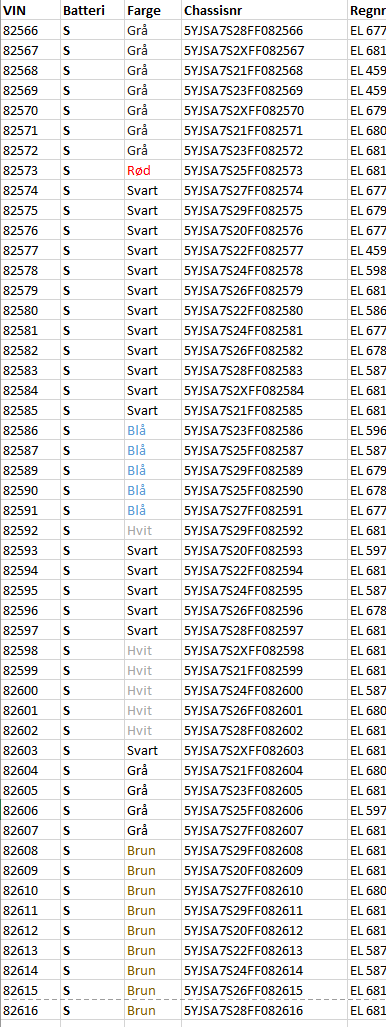
hobbes Wow, found a very interesting post from MrBacardi (the guy who collects and posts the Norwegian registrations on elbilforum.no)! From this it seems at first sight that they do not skip any VINs and they are definitely batched by color. Also, the cars being batched by color would mean they are produced in the order of the VINs, at least for Norway - though Norway is a special case as they get their cars directly and not via the Netherlands, it is likely that they produce a whole batch for them at a time and put them on a ship. Post is of Aug 27. So I would guess those were cars delivered in Aug.
Just to check order of magnitude 114390 (highest known VIN scheduled for delivery, at late Dec according to post above) - 82616 (highest VIN of the Post quoted, assuming early Aug delivery) = 31774 VINs in about 5 months, about 6000/month, 1500/week - that is too much for it to be actual cars, but order of magnitude seems about right. So maybe the VINs are without gaps for a batch like the one reported from Norway, but there are gaps in between batches?
Pic from the quote:
 �
�
Oct 29, 2015
FredTMC interesting. Color grouping makes sense since Body-In-white (metal shell) goes to paint shop. I'd think it's more efficient for the paint shop to shoot a batch of cars of the same color. I have no specific knowledge. If anyone knows, let us know. Thx!�
Oct 29, 2015
esk8mw Well, mine (114390) is a blue 90D, for what it's worth. Tesla reassured me mid-December is a conservative estimate, though I'm not in production yet.�
Oct 29, 2015
Auzie I doubt that Tesla pays attention to speculating investors, and I doubt that Tesla would go out of their way to mess up their complex scheduling/supply chain/production for the sole reason of circumventing speculators speculating. Speculators will speculate no matter what...
My guess is that VINs are assigned in a particular order unknown to us, no skipping, as such skipping serves no purpose and would be likely to introduce issues in Tesla's supply chain and production scheduling.
Scrambling of VINs is more likely due to various reasons mentioned up-thread imho.
There is likely to be over-laid batching on top of some color batching due to other reasons as well.
Color batching makes sense for older manufacturing facilities. The design/layout of the paint line will determine the need for batching and the optimum batch size. It is possible that Tesla has overcome the need for large batching or reduced the batch size with paint line layout (workflow) design. I read somewhere that Tesla has paint robots that use quick exchange paint cartridges. If the paint booth is small, that would allow for efficient quick exchanges and efficient workflow. The size of the cartridge determines the batch size. It could be just a few cars.
It is possible that what appears to be skipped VINs are inventory cars (loaners, stores, sc), transit cars, or anything else.
I would be very surprised if Tesla would skip VINs because there is no upside in skipping them and there are downsides.
My understanding is that Tesla uses in house developed ERP system (Enterprise Resource Planning). For people not familiar what ERP is, SAP is more common industry used ERP. SAP is awfully complex, inflexible, prone to errors, hence Tesla developed their own system. ERP system must use VIN as quite relevant data point, and messing with VIN would either throw any ERP out of the whack (very costly to business) or would require extra programming to counter messing with VINs. I consider both of these unlikely.
My view is that the VINs are assigned in an orderly manner but the delivery gets scrambled to an extent, say few thousand VINs may get out of order at delivery. That VIN band error is huge on the delivery of several thousand cars/quarter but is not so significant when Tesla is delivering say 20k or more/cars per quarter.�
Oct 29, 2015
mrdoubleb Auzie, you may have missed "the great VIN counting fiasco" here at TMC a year or two ago. I don't have links to the old threads, but the story was basically:
- Tesla VINS were completely sequential and the TMC community did a darn good job of counting them and predicting sales, so much so, that some media sites started to rely on this analysis too.
- At some point things started to go south when Tesla decided it did not want half the internet tracking it's sales like that - they were much more secretive about this back then.
- While obviously they never released a PR citing TMC as the cause, at some point they changed the sequential method and some people here started to get too excited about big VINs coming out and overestimated sales by a good margin.
- Since then it is "common knowledge" in the investors' forum that predicting sales by counting VINs is not a reliable method.
Maybe a more senior TMC member recalls more details and can provide you links to the old threads. (I may be wrong on some of the details, this is just my recollection of events).
These days we get quarterly delivery numbers straight from the horse's mouth, plus we have solid registration data collected all over Europe every month and insideEVs seems to be OKish for ballpark US figures.�
Oct 29, 2015
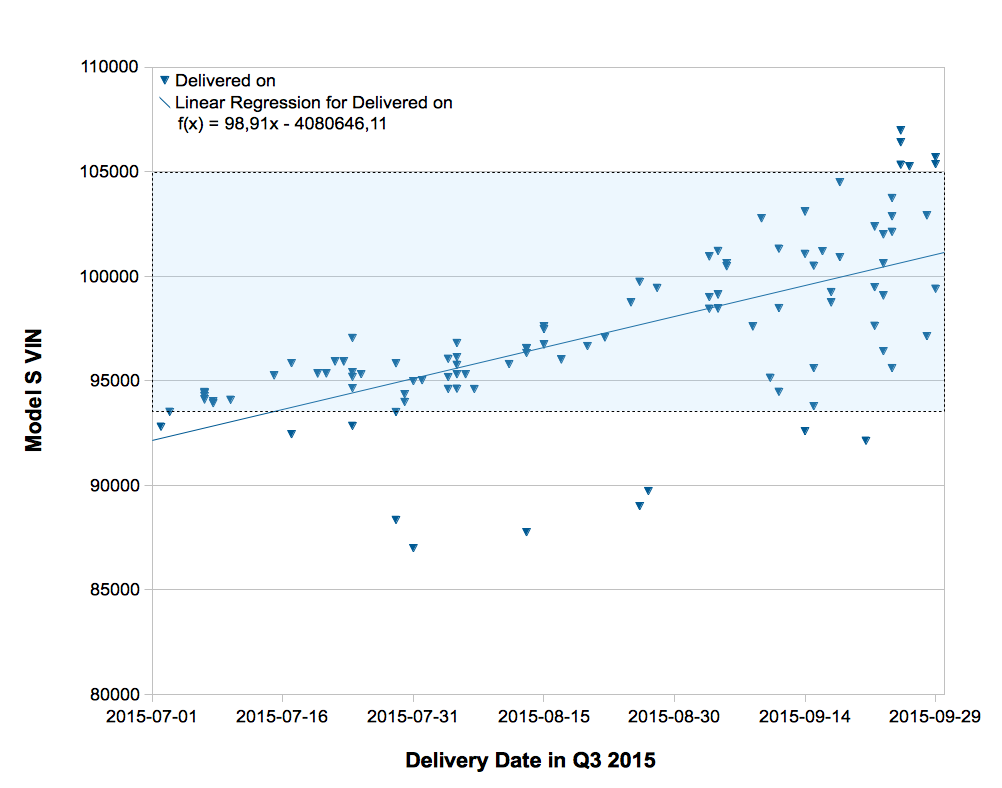
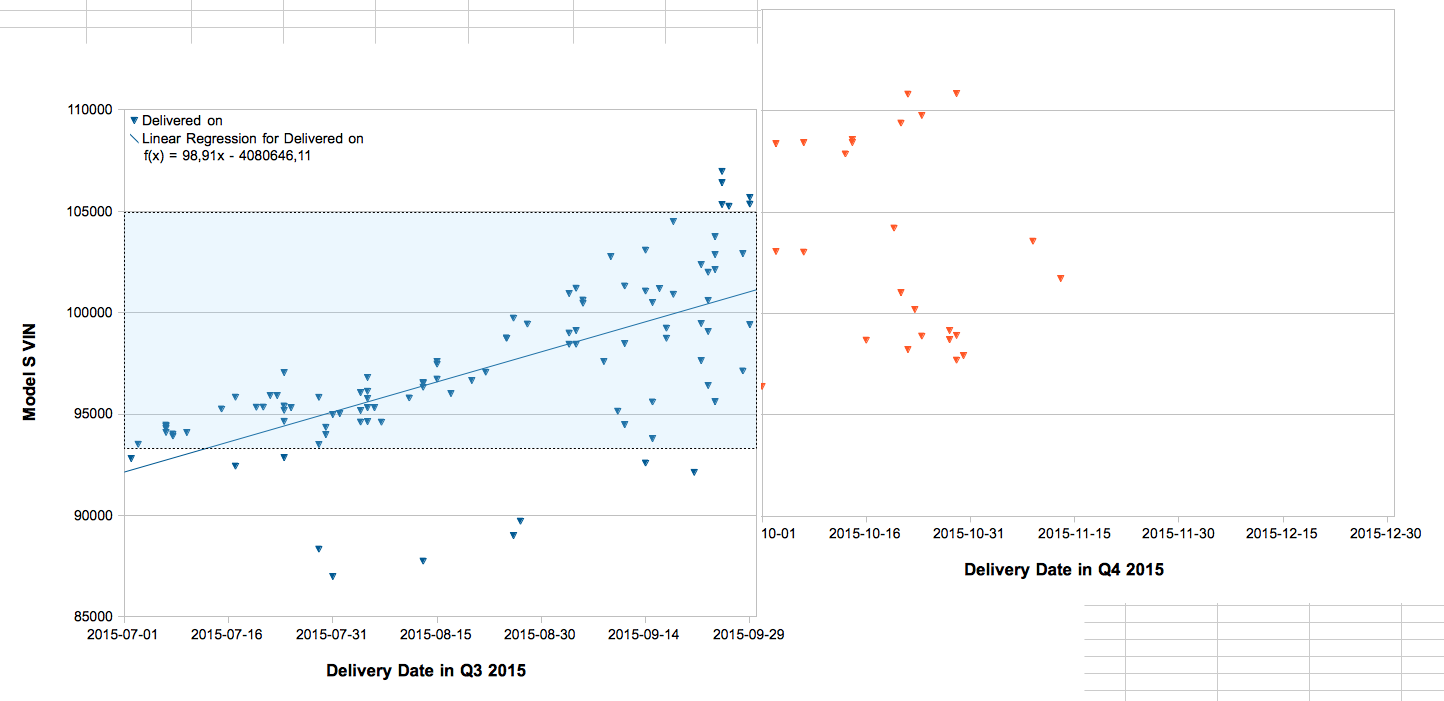
hobbes Throwing this out for discussion, shows VINs vs. their delivery date in Q3 (generated from Model S delivery update google sheet)
<update: the was an error in the plot I made which I just realized a day after making it: the time axis was not really a linear time axis, but just was in fact determined by the line number in the table I used, but labelled with the according dates. Will make a new one later.>�
Oct 29, 2015
doctoxics Not sure Tesla gets to 50,000 for 2015. Appears that the current Model S line is maxed at approximately 1,000 cars/week. S production in Q4 is not likely to be greater than 1,000/week unless the new S/X line is used to make Ss; that does not seem likely considering the need to work out the kinks in X ramp-up on the S/X line. Is there any basis for thinking that the old S line has been increased or that the S/X line is making both Ss and Xs? If not, seems like 47,000 cars in 2015 is the maximum that can be expected (assumes no more than 1,000 Xs made in Q4).�
Oct 29, 2015
FredTMC tesla will absolutely make more MS than 1000 per week in Q4. Proof: Here's a snippet from their ER from last quarter. Notice than one item is the 'Model S Body Center'. Allows for increased model S Body-in-white production.
We just concluded a planned one-week Fremont
factory shutdown and made changes in stamping, Model S
body center, drive unit production, battery module and pack
production and general assembly to allow for an elevated level of production and efficiency.�
Oct 29, 2015
Auzie
I am not saying my estimations based on assigned VIN are correct, it is just an attempt at estimation. These estimations are likely insufficiently precise to provide meaningful actionable information in regard to confirming that Tesla will reach the target.
If we had a situation in which the only VINs we were seeing on the threads were in the say 109000 range, then the above estimations can be used to deduce that Tesla for sure is likely to miss the target. In that respect, assigned VINs do provide some information.
Regardless of the theory validity, I have difficulty believing that Tesla deliberately scrambles VINs to confuse public. Do we have any evidence or data to confirm that? I find it more likely that Tesla becomes more secretive with their data. Their process is complex enough without extra deliberate attempts at making it more so by playing games with VINs. My 2c and I can be wrong.
If Tesla's run rate is only 1000cars/week, then they are unlikely to hit the yearly target.�
Oct 29, 2015
doctoxics Improvements in model S Body-in-white production:
Why then did they only deliver ~11,500 Model Ss in Q3? Seems that Model S production has been about 1,000/month for the past six months.�
Oct 29, 2015
FredTMC The factory retooling was in that Quarter. Lost over a week of production.
They produced over 12800 which was a blend of before and after. As they've said, they were driving for "efficiency". Not max throughput.
I toured the factory a month ago. Not my first time. I witnessed the changes made.�
Oct 30, 2015
schonelucht Very interesting graph! Thanks. Also interesting that the slope of the fitted lines 91 cars per day suggest (real number of deliveries were 125). If you graph the same for earlier quarters, is the same pattern there with the higher variation near the end of the quarter?�
Oct 30, 2015
hobbes Sorry, removed the plot I made above until I have time to fix it:
�
Oct 30, 2015
hobbes
O.k., fixed. Doesn�t really look all that different only that the dates are evenly spread their axis now. Also added a rectangle with a height corresponding to the 11580 deliveries in that quarter (its vertical placement is random):
 �
�
Oct 30, 2015
MikeC From this Norwegian data, it appears that VINs are assigned in an orderly manner based on region, car type, and then color: Decoding Tesla Model S VINs - Page 33
I understand MrBacardi who posted that has a list of every Model S delivered in Norway? It would be interesting to have a bigger sample size, with different types of cars delivered in Q4.
It looks like only one VIN out of 50+ was scrapped probably due to some type of production problem (or maybe a single orphan car was urgently made for some reason). I think the biggest risks of VIN counting is the filling of the pipeline and the widely varying lag between production and complete for different cars. But I agree with Auzie that it can give us viable information about whether production in the quarter was sufficient, at least.
Also, is there a tracker like this but for Q4? Model S Order Delivery - Google Sheets�
Oct 30, 2015
pGo There is one. In the same file.
I see that average VIN assignment has been following lately:
Weekly avg VIN assignment: 9/28 - 10/22: 1063
Weekly avg VIN assignment: 9/1 - 10/22: 1193
Weekly avg VIN assignment: 8/24 - 10/22: 1143
Weekly avg VIN assignment: 8/17 - 10/22: 1202
I have put VINs based on the dates assigned and then averaged out on a weekly bases. So, with this method you are looking at 1200/week VIN assignments. Not sure how this will look for the next month, but that's something important I consider.
Also, keep in mind that not all VINs assigned are to be delivered in Q4.
At 1200/week for 12.5 weeks, you are looking at 15000 cars production. Take this with a grain of salt as VIN assignment may not go along with production output though in the long run, you may be able to find a match.�
Oct 30, 2015
hobbes Had the same idea... Was going to make this nicer (all data points in 1 plot), but since you asked
 �
�
Oct 30, 2015
FredTMC
PGo,
nice data sets. Thanks for doing this MS VIN analysis. BTW. There are two new VINs assigned for 10/26. They are like 114606 range.
Tesla has told us that MX ramp will go slow at first and then ramp faster than what MS did. Elon mentioned exiting 2015 at 800/week for MX. And I recall that they are supposed to edit 2015 at 1600 cars/week produced.
Bottomline is I don't expect production to stay at 1200/week throughout Q4. I expect it to ramp (mix of MS and MX) from 1200 to something higher. Will they hit 1600/week in Dec? I guess we will find out. So, it seems reasonable they'll produce more than 15k in Q4 if they ramp as they said they would.�
Nov 1, 2015
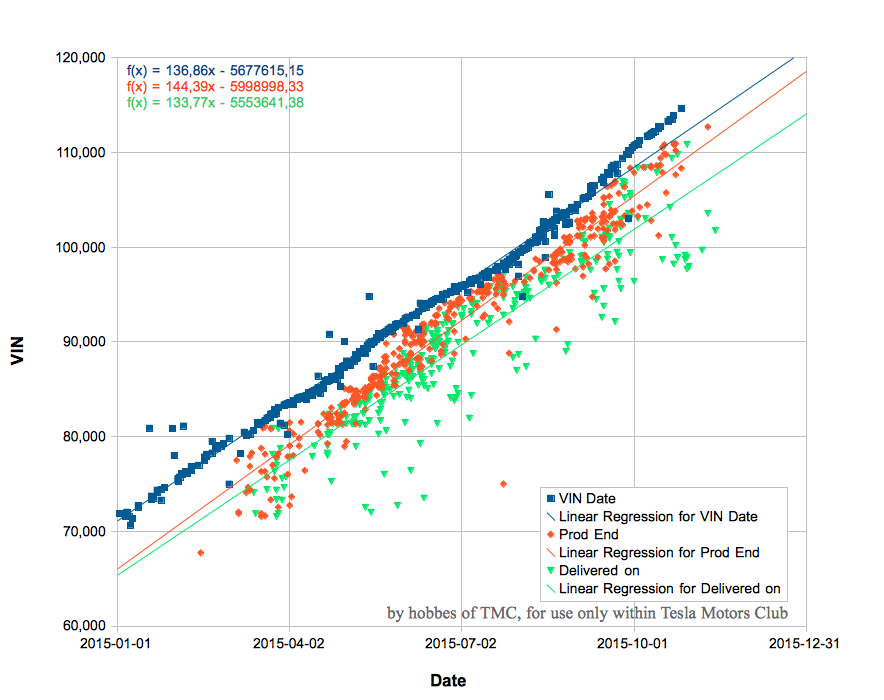
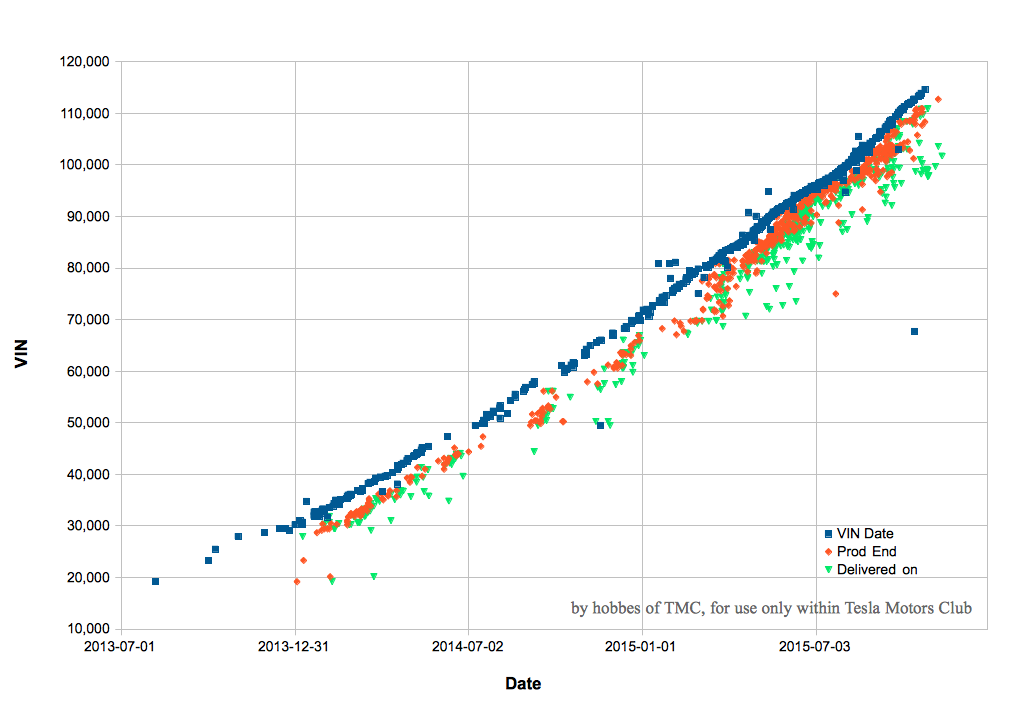
hobbes O.k., completed plotting the VINs. Disclaimer as before: This is only VIN data, Tesla could be skipping VINs which would lead us to overestimate cars produced/delivered by an unknown amount. I used the data from the Model S Order Delivery - Google Sheets (thanks for everybody submitting their data!), removing all data sets which had not at least a complete VIN and the VIN assignment date. Anyone could have entered wrong data there. Don�t base your investment decisions this. Also note that not all data sets used have all three dates (VIN assignment, production complete, and delivered).
Interesting feature from the long term plot (bottom) is that around April 2015 production times seem to have decreased significantly. Also, the slope of the data has been much more constant than I would have expected.
 �
�
Nov 1, 2015
doctoxics Pretty and very powerful. Thanks for the effort. Nice pick-up on the recent reduction in time from assignment of VINs to finish of production. Looks like about 12,000 Model Ss projected to be delivered in Q4, although the recent uptick in VINs may suggest a higher number.�
Nov 2, 2015
Benz Annual total Tesla Model S deliveries
2013: 22,477
2014: 31,655
2015: ?
In 2014 Tesla Motors realised an increase of almost 41% compared to 2013.
To get to an increase of 45% in 2015 (compared to 2014) Tesla Motors will have to realise 45,900 Tesla Model S deliveries.
To get to an increase of 50% in 2015 (compared to 2014) Tesla Motors will have to realise 47,483 Tesla Model S deliveries.
Which increase % is most likely to occur in 2015 (compared to 2014), 45% or 50%?�
Nov 2, 2015
mrdoubleb Well, to get to the minimum of their already revised 2015 target of 50-55k, they need an increase of 58%. I certainly hope this increase is the most likely to occur. :tongue:�
Nov 2, 2015
NigelM I can see 50%, so total deliveries in the region of 47-48k. To get any more than that Tesla will have to prioritise west coast customers and get a significant number of Xs delivered, that last one looks unfortunately increasingly unlikely.�
Nov 2, 2015
Benz My post starts with: "Annual total Tesla Model S deliveries".
I have excluded Tesla Model X deliveries (as there will not be that many this year anyway).
So the focus is primarily on Tesla Model S deliveries.
My post was not about the guidence of 50,000 - 55,000 annual deliveries (which is a total of both S and X).�
Nov 2, 2015
mrdoubleb I have excluded Model X deliveries as well. I always read 50k as the worst case scenario if X is delayed. So 50-55k meant 50 S and as many X as we can, but 5k max. At least that was how I read it.
Guess we will be smarter in about 26 hours.�
Nov 2, 2015
Benz It's positive that you are hoping for at least 50,000 Tesla Model S deliveries in 2015. Then that would indeed be an increase of 58% (compared to 2014). But for that to happen, Tesla Model S deliveries need to increase to almost 17,000 in Q4 2015. And that's not very likely, I think. But I hope that I am wrong about that. Tomorrow we will know more about this.
Cheers�
Nov 2, 2015
FredTMC i read it similar. Except I see that 50K includes some MX deliveries. I ran an estimate with 500 MX for example.
It now looks like tesla may deliver upwards of the majority of the sigs. Something like 1500. I like that's what Morgan Stanley is estimating on their middle-of-road estimate.
Do agree that if the scheduled late Q4 ramp goes as planned, then 55k was what is possible. 55k is the high end of the achievable targeted range.�
Nov 2, 2015
Gerasimental Could you give some clarification for the highlighted section? I was too busy and gave up trying to follow all the delivery estimates, VIN assignments, in-production e-mails etc. that were posted, and they seemed to be giving a very opaque image anyway. Is there any stronger, more consistent data suggesting what you claim above? Thanks.�
Nov 2, 2015
FredTMC
From what I've read on TMC, majority of sig owners are expecting delivery by year end. For any sig owners taking delivery outside the U.S. I can believe these cars wouldn't be delivered till next year due to ocean transit time.�
Nov 2, 2015
NigelM Guidance was for deliveries. A late Q4 ramp will not get cars to customers in time IMO.�
Nov 2, 2015
tentonine I've seen three reports of sigs not being delivered until January in the US, along with one in 'late December to mid-January'. I haven't seen a sig VIN higher than 7xx. So I think 500 might be a good estimate, but it would surprise me if it is much more than that.�
Nov 2, 2015
NigelM Feeling the same here; I'm not even certain that they have the capacity to deliver that many cars right now.�
Nov 2, 2015
FredTMC But a late Q4 ramp was always the plan (per last Earnings call). It's certainly the case that final cars produced at year end are cars to be picked up at Fremont and bay area�
Nov 2, 2015
Benz It would be fantastic if they indeed could deliver those 1,500 Tesla Model X SUVs in November/December 2015. Let's hope that they will be able to do that. But then they still would have to be able to deliver about 15,500 Tesla Model S sedans as well. I don't want to spoil the party but I think that it's a big jump from 11,580 to 17,000 in just one quarter, to be honest.�
Nov 2, 2015
NigelM Not disagreeing with you, but those would have to be Model Ss; the X Sigs are spread around the country.�
Nov 2, 2015
mrdoubleb Well, if that is true, this is a screw up on multiple levels. I can understand the Model X ramping difficulties due to lack of parts - Tesla has been very vocal about this throughout the year, so it should come as no surprise. However, they "always" said they expected a steep ramp to a few thousand X this year and the majority next year.
May have been just me, but that always translated to a significant Model S ramp as well, here is why: the original guidance was 55k of S + X combined. If Model S stayed flat to 2014, that would only be 31k, meaning 24k Model X which was surely never promised. So if X was "always" supposed to be only a few thousand in 2015, Model S had to ramp to around 50k.
At the same time they announced lowering guidance to 50-55k in the Q2 ER, they also announced that they planned to produce 12k and deliver about 11.5k in Q3. So clearly, at that point they projected delivering the missing 17k-22k cars in Q4. A few thousand Model X notwithstanding, that means the S was supposed to ramp as well.
So, as Q1, Q2 and Q3 went according to plan, unless you interpret the last ER projections as guiding for up to 10k Model X in 2015, they surely have planned to significantly ramp Model S in Q4 as well. And as we haven't heard about any S production difficulties lately, if they are on plan, they should deliver that at the very least.
I know I am waaaay overthinking this.�
Nov 2, 2015
Benz That would be an increase of almost 47% compared to Q3 2015 delivery total !!!
Would be awesome though, but he let's be realistic.�
Nov 2, 2015
hobbes
Not overthinking, I see it exactly the same way.
50,000 S+5,000 X they might have believed to deliver for 2015 after Q2 (although they did not state that distribution) going to 50,000 S + 500 X is my guess.�
Nov 2, 2015
NigelM I wouldn't go as far as phrasing it like that. I'm guessing that they originally anticipated an X ramp to deliver a few thousand cars this year but knew that they'd have to balance delivery capacity with that ramp being contingent on final testing, suppliers, component availability etc.
That number probably hinges on the success of the referral program. Question is: would Tesla have increased delivery capacity assuming they have 17,000 fillable orders in Q4?
Model S ramp above 1,200 per week? Who knows.
Perhaps, or maybe I am.�
Nov 2, 2015
FredTMC Yup. Specifically for the MXs, the ones outside CA (Florida for example) get built in first week or so of December. Then it takes a week(s) to transport to FL Service Center and prep delivery for late December.
I imagine we will probably also see "direct deliveries" (cars directly dropped to owners homes). We've seen this in the past.
Bottom line is I except a big wave of MXs to get delivered in the last few weeks of Dec. Seems to always work this way due to transit lead times.
- - - Updated - - -
You aren't overthinking it
This is exactly how I interpret it. Q4 is a ramp for MS as well as MX.
Specifically tesla told us last ER that MX ramps late in Q4
Also, we have had some evidence of MS production running at 1200/week. this matches well with Tesla mentioning in last ER that the MS body line was improved.
Boy, tomorrow is gonna be "interesting". I'll make some popcorn�
Nov 2, 2015
NigelM Well that would make a lot of people round here very happy; but realistically it's more approaching 3 weeks door-to-door and then only if Tesla switches back to full truck delivery rather train/truck. I'm not saying it's impossible, just that there's enough doubt in my mind to make me feel a little bearish on the delivery guidance.�
Nov 2, 2015
FredTMC ya. Very challenging no doubt. Tomorrow will be very "exciting"
last year Nigel we had this same discussion. You were RIGHT and I was WRONG.
I reman an optimist this time. You're the Realist.�
Nov 2, 2015
pGo I just checked VIN assignments for last week and is steady at 1200/week. So for sure the pace has picked up and stayed higher in the past month or so. Now question is if this number is enough to meet 50k.. And if it goes higher/lower from here or stays flat for the rest of the quarter.�
Nov 3, 2015
schonelucht There is now enough data to estimate with reasonable certainty that Tesla delivered between 1000 and 1200 cars in Europe in October. As far as we know, these are all model S cars. This compares to 1155 cars in July '15. One caveat is Denmark. I expect/hope they surprise us with a huge surge because of the changing incentives in 2016. Since my estimate does not account for such a surge, I am fairly confident there is more upside to the given range than downside risk.�
Nov 3, 2015
Benz Is it possible that Tesla Motors will have produced about 15,000 (or maybe even more) Tesla Model S cars, and that a significant portion of those are still in the pipeline?�
Nov 3, 2015
tentonine This worries me because these VINs will be delivered in December. There therefore isn't much time left until the end of the year. December-delivery VINs have been issued for a while now and some recent orders have been told mid-December for delivery, so I would guess that Tesla has at most 2.5 delivery weeks' worth of VINs still to issue for this year. This means that a steep increase in assignment rate may be needed right now if they are to make guidance by the end of the year...although of course they might be able to compensate from inventory or partially emptying the pipeline to foreign countries.
I have a related question: does the factory close for Thanksgiving, Black Friday, Veterans' Day, and Christmas Day?
- - - Updated - - -
Yes - a big part of the challenge is scaling up deliveries, not just production. This is a particularly big problem at the end of the year when a lot of people are away for the holidays. That was a big part of the reason why P85D deliveries were lower than expected last year - although they had resolved production issues in time for the end of the quarter, they were unable to deliver a significant number of cars at the end of the year.�
Nov 3, 2015
tentonine Another important point: Tesla is already assigning VINs for European deliveries as far away as February, so the current VIN assignment rate need not be directly related to the expected delivery rate for the rest of this year.
http://www.teslamotorsclub.com/showthread.php/9489-Model-S-Delivery-Update/page279?p=1223442#post1223442�
Nov 3, 2015
pGo I expect the VIN assignments to drop to somewhere around 800-1000 cars in a week from now. The reason being the last bump is already seen now with the most recent assignments. This bump at the end or referral program is not huge and it seems like the effect of higher rate was visible in the past few months. Not sure what will drive higher reservations from here on as some demand is pulled forward due to referral.�
Nov 3, 2015
Benz Not if the orders for a Tesla Model S keep coming in, in increasingly higher numbers (for whatever reason).�
Nov 3, 2015
Benz There you have it, mentioned in the Q3 2015 Shareholder Letter:
"In Q4, we plan to build 15,000 to 17,000 vehicles, and deliver 17,000 to 19,000 vehicles, which will result in 50,000 to 52,000 total deliveries for the year."
"We expect that Model X will achieve steady state production capacity during Q1 as we do not foresee any significant
production, design or supply chain constraints that will impact this plan. Looking ahead, we still remain highly confident of
average production and deliveries of 1,600 to 1,800 vehicles per week for Model S and Model X combined during 2016."
They are expecting a lot of orders in 2016 for both the Tesla Model S and the Tesla Model X.
�
Nov 3, 2015
pGo So they expect to continue at or above 1200/week - (at some point including MX as well). That's a positive surprise.�
Nov 5, 2015
NigelM Well, this time around the situation is kinda reversed. I was wrong about guidance being lowered, but I'll still be blown away completely if they actually can deliver 17,000 cars in Q4.�
Nov 5, 2015
chickensevil You and the rest of the market, I hope.
Based on the numbers they published, and what we have seen the wait times push out to. It looks like for at least this quarter they are going back to prioritizing deliveries of a region. As I am going through the new car buying process all over again, I can help give whatever quirks and insights I see. Ordered Oct 18, Confirmed Oct 25th, 5YJSA1E23FF114557 vin number, East Coast delivery, and I was told "You will have your car before Christmas". For whatever that is worth!
An interesting conversation I had as it relates to VINs with one of the service techs was that apparently some customers have been allowed to get a VIN assigned but not actually get a car produced for them. Such that when they finally get the car made, they have a super low VIN number but it was actually made recently. He mentioned confusion about a customer complaining about their "camera" and he saw his VIN and thought, oh yeah, I'll take a look at the camera, bring it in, (thinking it was about the backup camera), only to find out that the car actually had the autopilot hardware in it.
Based on what we have seen from the Norway numbers, there is very clear batching of the VINs and they seem to go in order. What we don't know is how many inventory cars get made and how they get moved around. I also know that they now have loaner cars at my store that will basically never be sold. I got a P85+ recently that was around 1 year old without the autopilot hardware in it, and the guy said that if I tried to buy it from him he couldn't sell it. So I would expect some VINs to be forever lost into the void for that reason. Otherwise I think the VIN risks have been pointed out pretty well in the thread and it does make it tough to pull good numbers.
The regression chart is likely the best hope of speculating on deliveries based on VINs since somewhere in the middle is likely to be a number that we can sit on.�
Nov 5, 2015
FredTMC Yeah. It'll be quite an achievement if they do�
Nov 5, 2015
larmor Just need some MX in the showrooms, and orders will be flying in...
�
Nov 5, 2015
DaveT Yep, hats off to FredTMC (and a few others) who kept believing Tesla wouldn't lower guidance.�
Nov 5, 2015
FredTMC thx Dave!�
Nov 6, 2015
schonelucht +1. I totally didn't believe his these but it turned out spot on, including running down the pipe and all. Well done and I hope he reaped the financial rewards from his foresight.�
Nov 10, 2015
RobStark 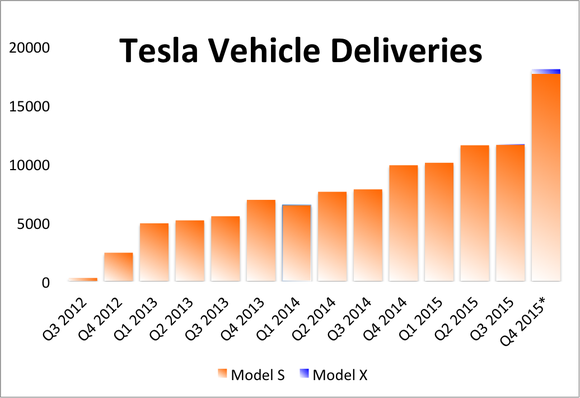

 �
�
Nov 11, 2015
hobbes
Interesting, thanks for posting. Could you please add the link to the article you took the graphs from? Would like to look up some details...�
Nov 12, 2015
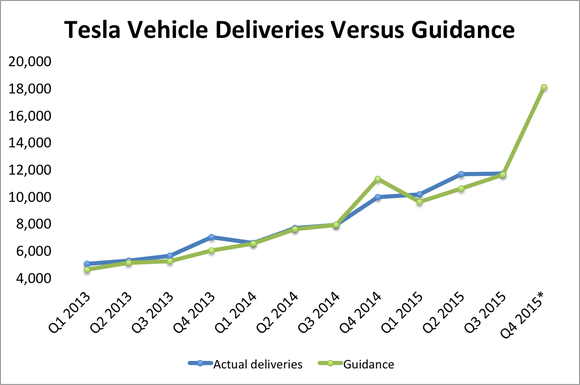
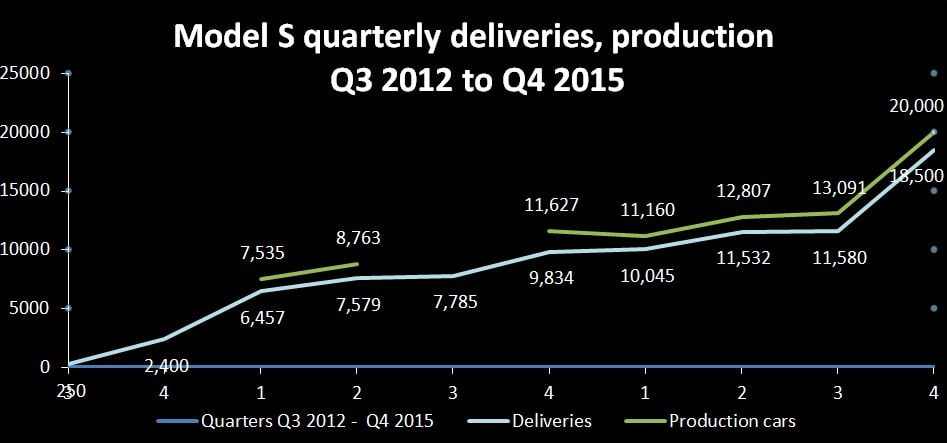
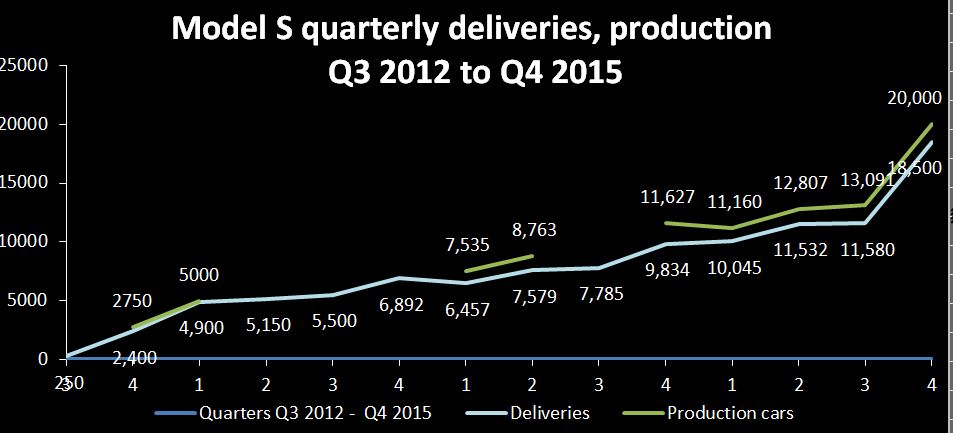
chickensevil He might have made them himself. This was all open data pulled from their reporting.
The cool thing here is that this is by far the largest single quarter growth percentage. I didn't realize how much of a growth this was compared to Q4 of 2013 or Q4 of 2014. Thanks for these!�
Nov 12, 2015
RobStark Can't you right click to grab the url?
https://g.foolcdn.com/editorial/images/185194/tesla-vehicle-deliveries-2015-q4-guidance_large.png
Anyways they are from the motley fool.�
Nov 15, 2015
pGo The new orders rate has dried a bit - though very inconclusive at this stage. I was able to find only a handful of new orders for the past 15 days. On the other hand, VIN movement is still there due to rush to order by 10/31 and the confirmation within 1-15 days from 10/31.
Next week will actually tell more if VINs are being assigned at the same rate. I would assume not as some demand was pulled forward at the expiration of the first referral program.�
Nov 16, 2015
chickensevil Oh, ha! I think I was on my phone when I posted that response, and I thought most people pulled the content down directly rather than just doing a link to it. Generally when I post pictures that is how I do it. *shrugs*�
Nov 25, 2015
MikeC Well, we have VIN 114920 already being scheduled for delivery on December 2: Model S Delivery Update - Page 867
For those daring to wade into the dangerous realm of VIN counting, I think things are looking pretty good for guidance.
The Model S Delivery thread really seems to be moving quickly these days. Along with emptying inventory cars and the international pipeline, I'm pretty confident about 50k and am starting to be hopeful of breaking 52k. I'm expecting share price appreciation through December anticipating end of year numbers by January 3, especially as more analysts start to project confidence like Galves from Credit Suisse did today. Even if they just make guidance, I think the huge jump in deliveries and revenue will make for impressive headlines.�
Nov 25, 2015
Auzie There seems to be quite a wide band of deliverable VINs in the same quarter.
Norweigan delivery as low as 108k

US deliveries are in 114k+ VIN numbers
Higher optioned cars seem to be prioritised (P90DL etc)
I would not trade on VIN information, but then I do not usually trade on anything but macro view. If I had more time, it could be worthwhile figuring out more about VIN assignment rules, as quarterly delivery numbers do have a strong impact on (short term) share price movements.�
Nov 25, 2015
MikeC We know from the wait times they have been prioritizing US orders for a while now, the big question to me is whether they are assigning all the VINs to the US cars they are currently making or if they are mixing in VINs of international cars that won't be delivered this quarter.�
Nov 25, 2015
Auzie My expectation is that there is some rhythm of assigning VINs in a quarter.
VIN rhythm might go something like:
Early quarter - remote overseas VINs (Oceania)
A bit later in the quarter - Europe
Mid-quarter - remote US regions and Canada
Late quarter - US regions close to factory
Such assignment rhythm might be overlayed with late orders from some regions jumping the queue if they have a chance to make their region quarterly shipments.
I have no data to support this, just my wild speculation. That only makes sense if Tesla wishes to maximise deliveries. That is a reasonable assumption.
I also speculate that Tesla is increasingly reducing inventory by selling cars to Tesla employees, maybe at a discount. That would make a lot of business sense. Tesla employees/owners are the best brand advocates/sales generators.�
Nov 26, 2015
Benz VIN 117390 to be delivered early December in South California.�
Nov 26, 2015
FredTMC great summary. I think you nailed it�
Nov 27, 2015
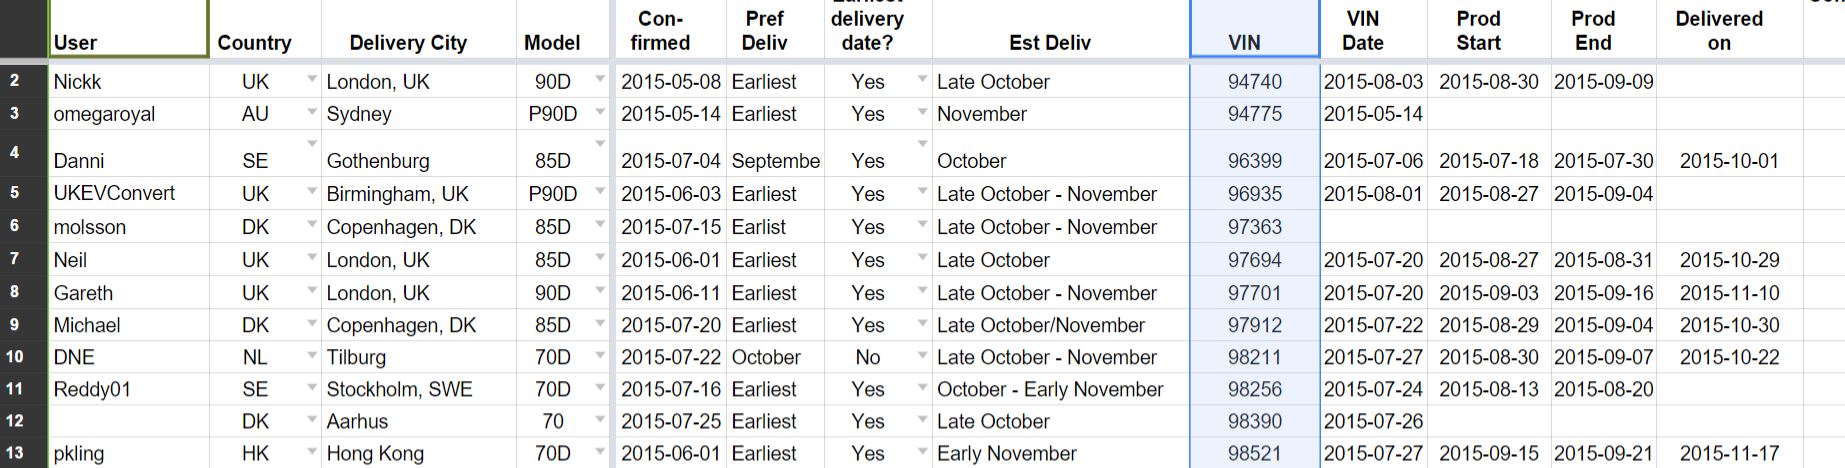
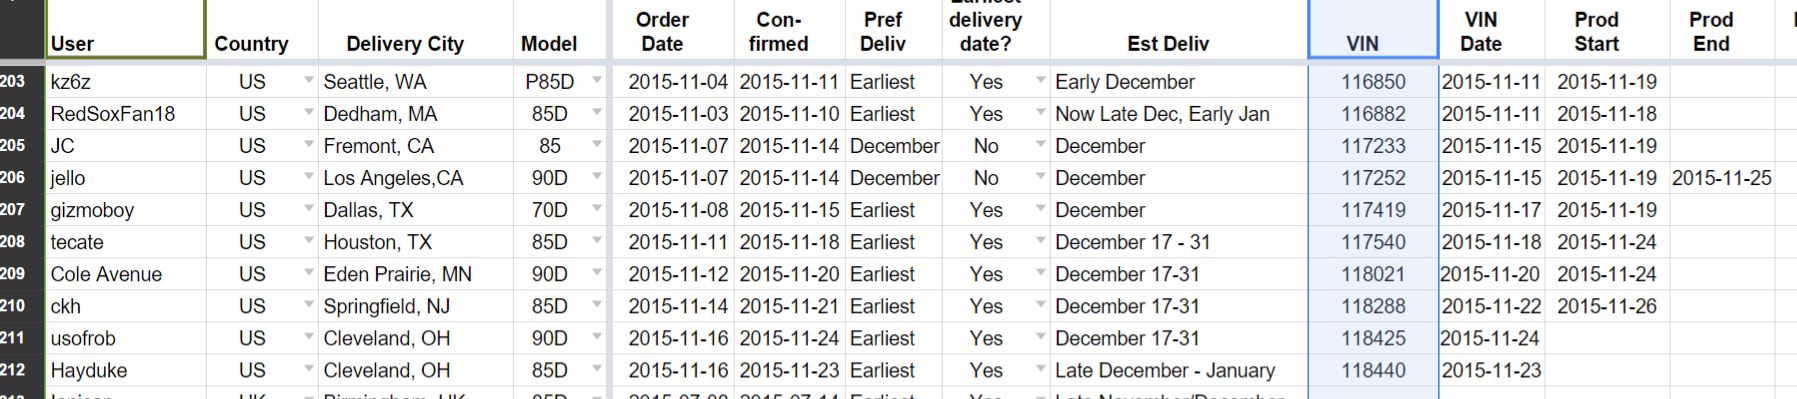
Auzie google docs Models S Orders, q4 sorted by VIN
early q4
late q4
 �
�
Nov 27, 2015
uselesslogin It is better to look at a single region only. For example VINs as high as 106xxx were delivered in Q3.�
Nov 27, 2015
ev-enthusiast What is your conclusion?
I know we are not allowed to do some 'calculation' with VINs, but here we go (could provide an estimate though):
VIN(lateQ4) - VIN(earlyQ4)= increased order rate from earlyQ4 to lateQ4
116859 - 94740 = 22110
118440 - 98521 = 19919
That could translate to about 20000 cars more ordered late in Q4 compared to early in Q4.
As this increase in orders could be more than Tesla produced during Q4 up till now this could suggest that Model S order book increasing significantly despite of Tesla significally ramping Model S production?!
Any help appreciated.�
Nov 27, 2015
MikeC I agree, I have been trying to keep an eye only on Fremont deliveries to reduce the variability introduced by transit time.�
Nov 27, 2015
Auzie If that is so, then it is even more compelling to give it a go :biggrin:
Looking at google docs is quite informative. Although many pieces of the puzzle are missing, numbers that are there are telling. In this case, info is evaluated based on whether it is visible or not. If we see VINs in 118k that is telling.
Tesla is getting orders that push into 118k for model S.
I was curious where did VIN 100,000 end up, and google has the answer, as usual.
Surprise surprise:

Maybe VIN 100k is sitting in Fremont as a historic piece, never to be sold or someone at Tesla got a hold of that car
Here is the spread of VINs in the past quarters, shown in the same table as actual past q cumulative delivery numbers:
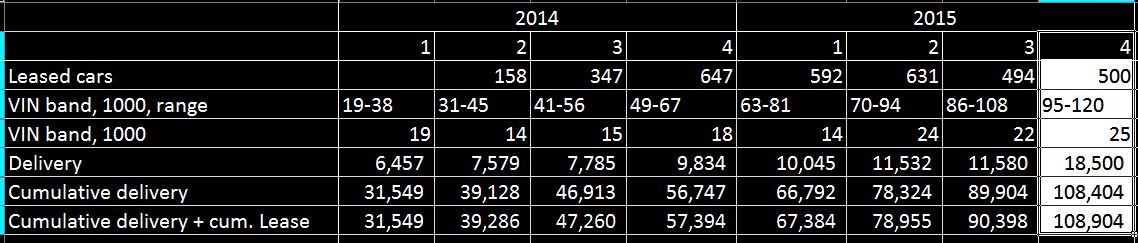
q4 numbers are my reasonable guesstimates, based on visible VINs so far and based on past performance
Some observable patterns in the table (I see patterns everywhere so take it with a grain of salt):
Actual cumulative delivery falls somewhere mid range point in the q VIN band range, it is not on the low side or high side of that range. Q1 in 2015 is an exception to such pattern, with actual cumulative delivery falling close to lower end of VIN range for that quarter, most likely due to starting the year with an empty pipeline.
Feel free to see your own patterns.�
Nov 27, 2015
TSLAopt Great data, thanks! Would add # cars produced for each quarter in there too though�
Nov 27, 2015
Auzie Great idea, here it is
google doc does not have pre 2014 data, hence my table only shows 2 years as well.
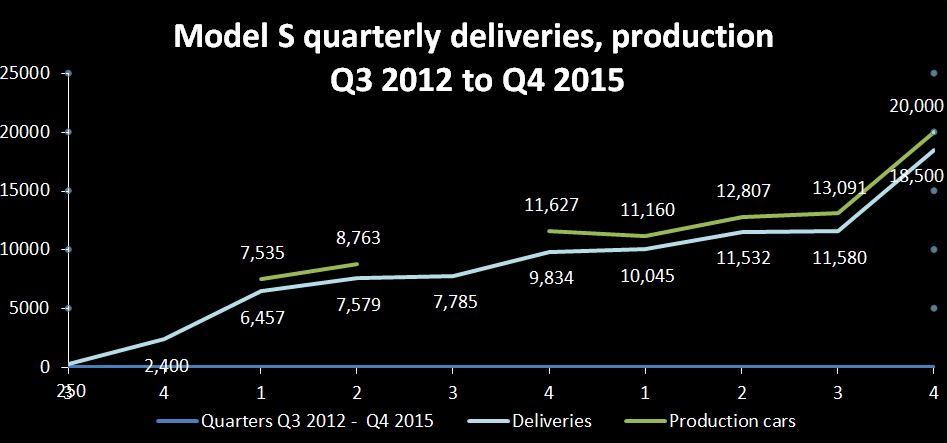
Graph of the production and delivery q data shows how nicely deliveries track production, suggesting production constraints - Tesla delivers most cars that they can make
Note: data from q reports, missing data not reported
2015 q4 numbers are my imagination�
Nov 28, 2015
hobbes Motivated by Auzie�s work, I updated my VIN plot, too. Trend continues pretty much. Added extra marks for non-US deliveries (dark green triangles). Shows the latest deliveries are in fact almost exclusively outside US.
Playing with the slopes of the linear fits (multiplying by 365 days), they point to 51,899 VINs/52,863 cars produced/50,432 cars delivered in 2015 (Jan 1 through Dec 31). Obviously they won�t produce more cars than assing VINs, that's the statistical error. To reduce that, averaging the three numbers gives 51,731. That would be my best educated guess at Model S deliveries in 2015. Add a few hundred Model X and they *might* hit the upper end of guidance.
DISCLAIMERS: This analysis obviously assumes that the cars produced in 2014 and delivered in 2015 make up for any cars produced this year and only delivered in 2016. (The plot has only VINs which were assigned this year, so it might seem there were no cars delivered in early 2015.) VIN analysis has led to too high forecasts of deliveries earlier on TMC, so take this with a spoon of salt and don�t base your investment decisions on this.
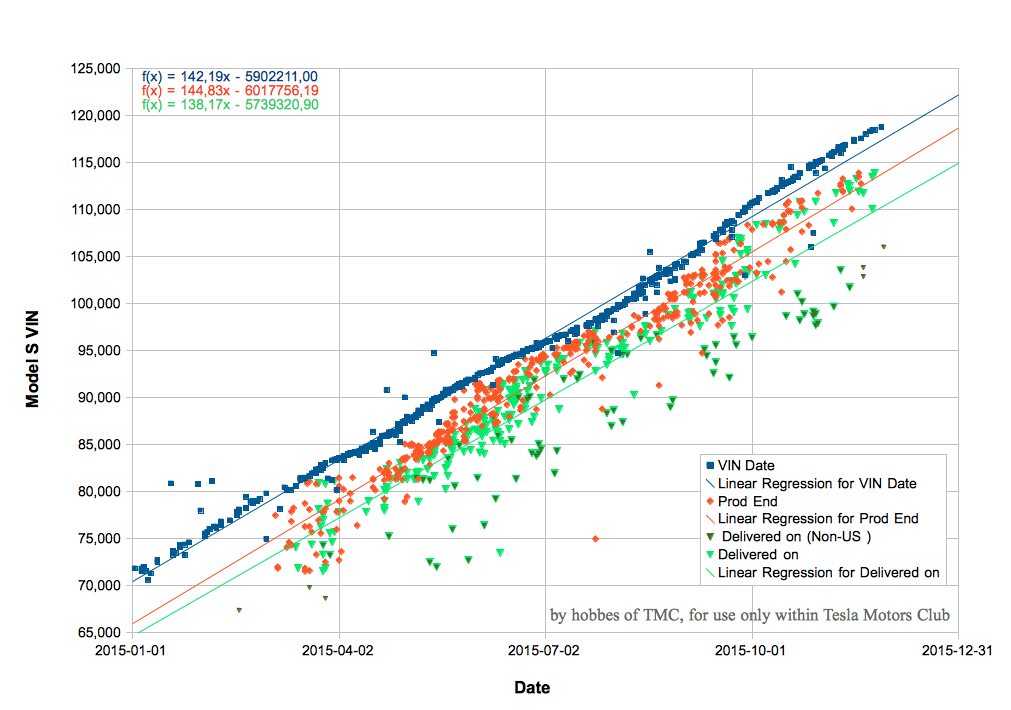
Data source: Model S Order Delivery - Google Sheets�
Nov 28, 2015
Auzie Thanks hobbes, I enjoy watching colorful graphs.
I was contemplating developing more complex VIN - date graph that would show overlays of order, production and delivery dates for each VIN. Still contemplating when I get a spare moment, hoping that someone might beat me to it.
I am curious if anyone remembers if previous VIN discussions here on TMC coincided with excessive inventory being built for China?�
Nov 28, 2015
hobbes Not sure what you mean exactly - what is missing in the plot I posted? I was thinking about investigating what went wrong back when the VIN analysis went wrong, too... Would be interesting so we don�t possibly make the same mistakes again.�
Nov 28, 2015
MikeC It was after Q3 2013, which was a miss and came during the infamous fire period. Here is a bullish SeekingAlpha article from the time that unfortunately was very wrong: VIN Data Shows A Tesla Q3 Blowout Coming - Tesla Motors (NASDAQ:TSLA) | Seeking Alpha
A connection to China may be possible because I believe homologation to China was completed around that time, although the first wasn't delivered until April 2014.�
Nov 28, 2015
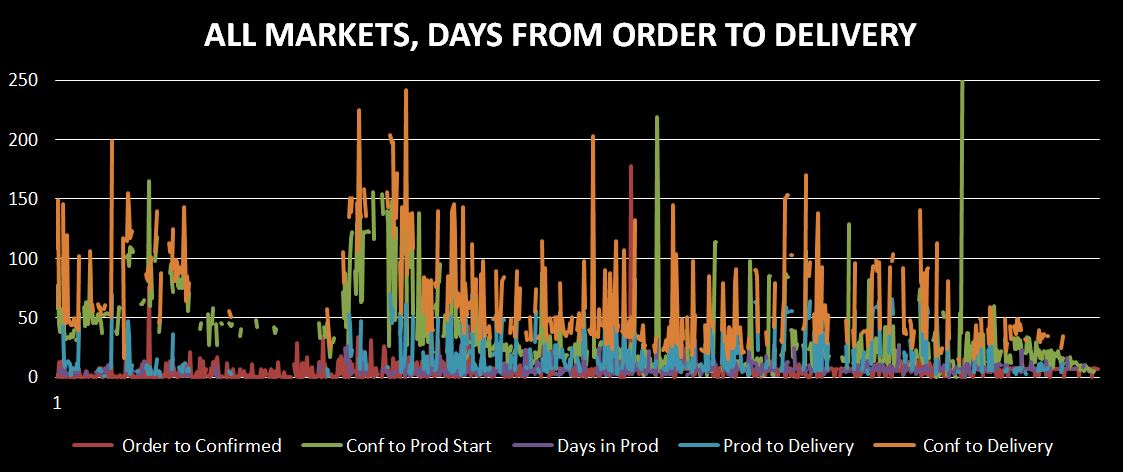
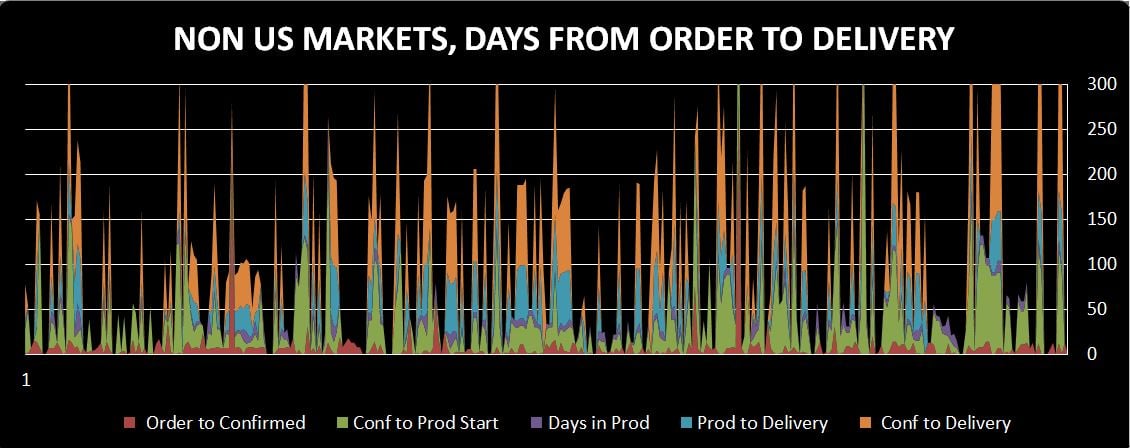
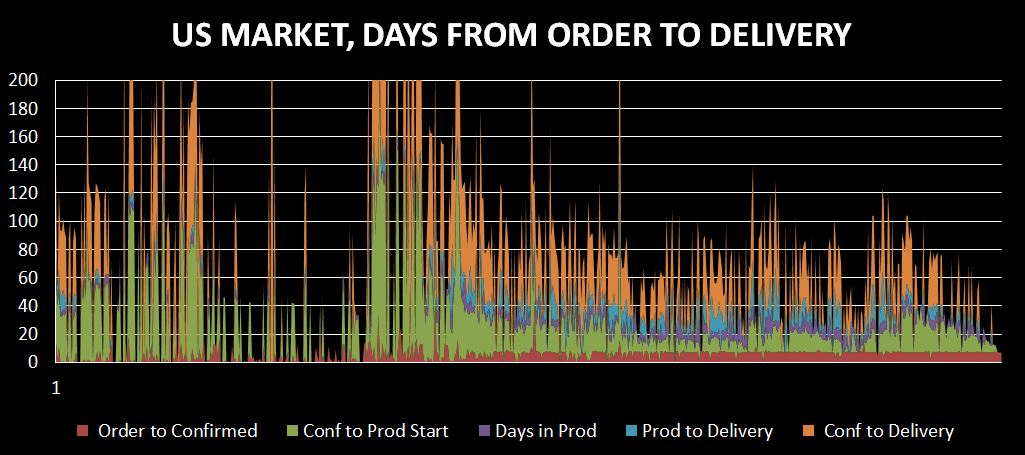
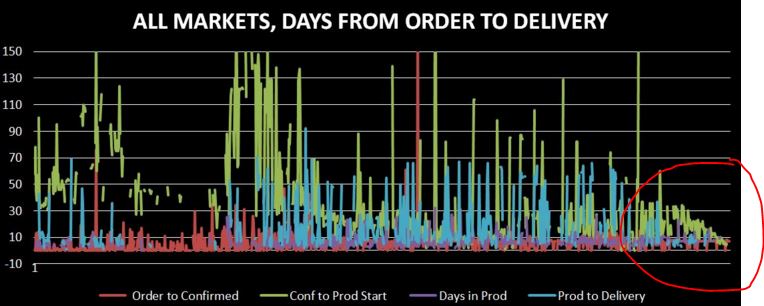
Auzie Few more graphs from VIN data google docs
The graphs show delays in days, from order taking to delivery, in US and non-US markets.
Unfortunately, I lumped Canada into non-US markets as it became too tedious to clean data, people were filling in towns rather than countries and filtering is tedious. Graphs could be much better with more granular markets separation.
The horizontal axis on the graphs is VIN numbers in ascending order, not displayed. Displaying VIN numbers is not informative on these graphs, it would only clutter the picture.
 �
�
Nov 28, 2015
Auzie No mistakes in your work, it is great, I was just curious about the different delays from order to delivery in different markets.
- - - Updated - - -
Here are the same graphs with some redundant data removed, to improve clarity
Confirmed to delivery delays can be deduced from the other delays, so I removed it.
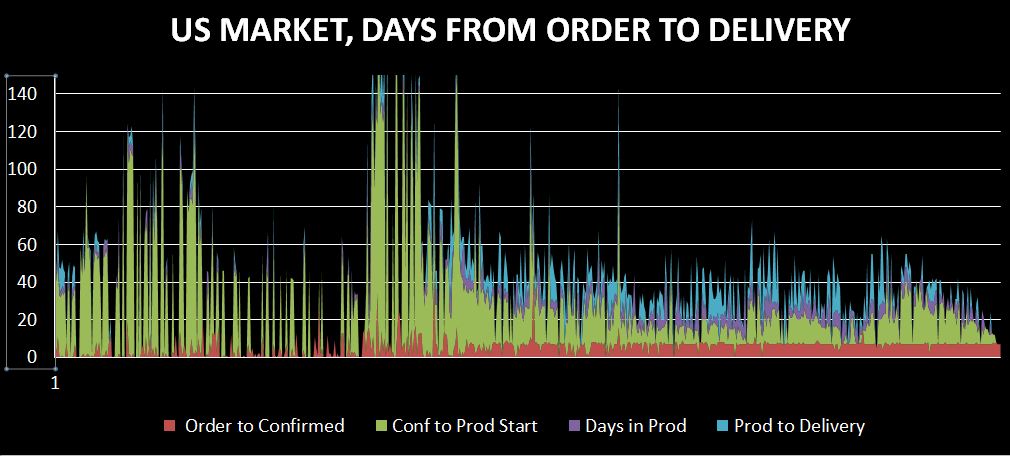
All three graphs show short consistent delays between order to confirmation and days in production.
Longer delays are in between confirmation to production start and production to delivery. No surprises there.
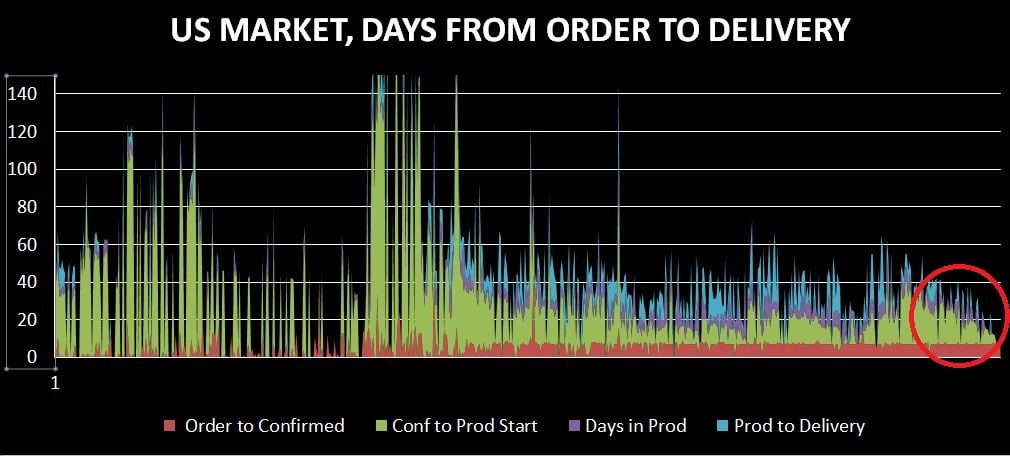
I really like the evident mastering of the US market scheduling and shortened delays between confirmation and production start in that market.�
Nov 28, 2015
Auzie
That is interesting, such timing
Checking this graph again
Note how there is missing production data on 2013 q3 production numbers. It is possible the number was selectively not reported as reporting it could show a high inventory of undelivered cars. Finished goods inventory was unreported few times as well.
Deepak is quite creative with words (reports). He statedin q3 report but missed to provide full production number for the quarter, as was done in all other quarterly reports.
Just my speculation, it is irrelevant now. However, if hidden (at the time) China inventory affected wrong VIN assumptions at the time, then VIN data is informative. I find it informative.�
Nov 29, 2015
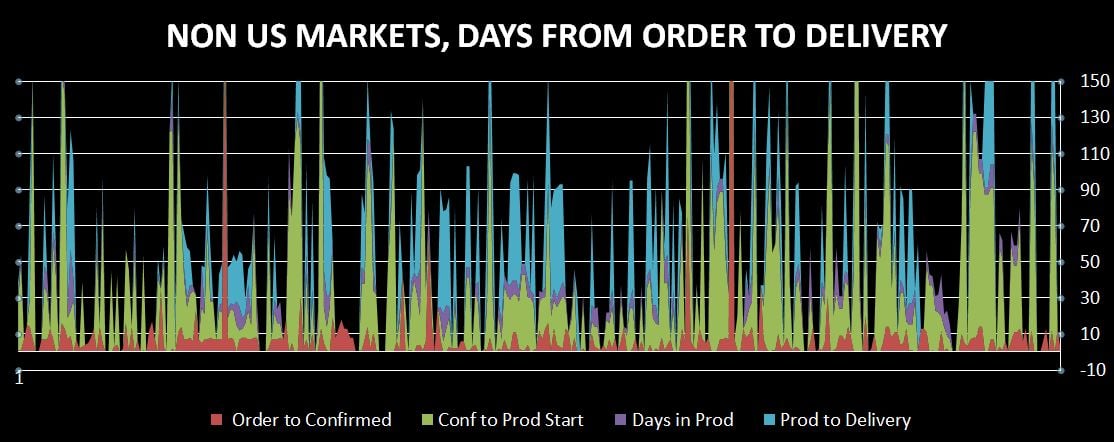
hobbes Ah, you wanted the time differences between the different steps VIN...delivery. Now I get it.
Interesting how much the delays have changed over time though. Actually, what time span do your plots cover? I think the data would become even more clear if you could plot it just with dots, as I think the lines cover up some of the data points.�
Nov 29, 2015
Auzie The graphs were plotted with VIN numbers sorted in ascending order on Horizontal axis. I chose not to display VINs as the numbers are 5-6 digit numbers, there are over thousands of VINs and they would greatly clutter the graph if displayed. Time (dates) and VIN numbers are correlated, hence we could say horizontal axis is representing both time period (2014 - 2015) and VINs.
2 delays seem to be constant - order to confirmation is flatlining at 7 days, and days in production seems to be consistent at just a couple of days.
Delivery days obviously vary depending on the region.
Inverse correlation of Confirmation to production start in US and non-US market is evident, not surprising at all.
The last time period on the graphs (circled areas) shows long conf to production in non-US markets (approx. <90 days) and quite short conf to production in US market (approx.< 7 days), due to prioritising US production for the year end.
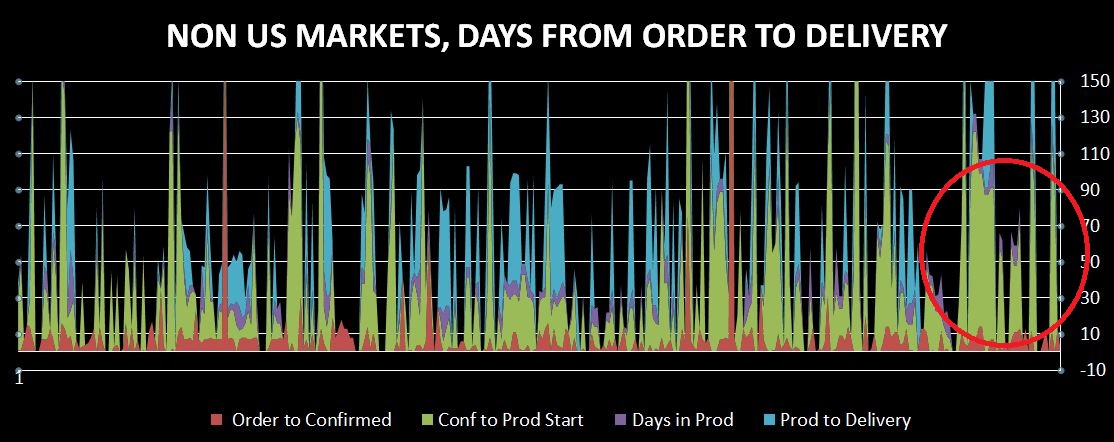
Note: All delay days for the same VIN number are stacked on top of each other.�
Nov 29, 2015
hobbes Interesting read, thanks. I followed the links in that article and found the original thread and charts on the Tesla Motors Forum by Craig Froehle (actually he took the charts offline but you can still find them on google image search). Back then he had only the VIN data available. I think by analyzing production end and deliveries now in addition we are a bit less prone to error - but still, the analysis I made with my plot works only if there is not a sudden problem (think strike stopping deliveries or bad weather). Actually I have a good idea how to validate the method, I�ll see when I have time.�
Nov 29, 2015
Benz Nice graphs, thanks for posting them.
I understand that you used VINs from 2014 and 2015.
Looking at the second graph (US Market), it's very clear that VINs in 2014 had a much longer delay regarding "confirmation to production start" (green lines), and VINs in 2015 had a much shorter delay regarding "confirmation to production start" (green lines).
There must also be a relation with the increase in production capacity, I think.�
Dec 3, 2015
Auzie My previous Model S quarterly deliveries chart was compressed, 2013 q data is missing. I got 2013 q columns hidden in excel when working on last 2 years data and forgot to unhide when plotting the graph. Here is the full plot, with 2013 quarters included.
There is an article in Seeking Alpha that looks at the google doc Model S delivery data and interprets shortened end of year delivery delays as declining demand.
The author looks at US market only and does not consider the possibility of rising production rates. The rising demand in non-US markets will be reflected as longer delivery delays in the next quarter.
My expectation is that Model X demand, possible new catalysts for Model S (improvements) and raising demand in non-US markets will keep Tesla fully occupied until Model 3 kicks in.�
Dec 3, 2015
chickensevil I don't really feel inclined to comment *in* the linked article, but just to clear up something. He states:
I think what is being missed here is that he is *only* considering the US market. Didn't they say recently that the EU overall has risen to the point where it is at least on even level with the NA market? Or am I missing something?
And VG had an interesting hypothesis on allocation as it relates to the estimated delivery dates as being that they are lumping a predicted amount of cars into a region/country. If they get more orders than expected it increases the wait time for that country, and if they get less, it drops the wait time. This of course was thrown out for NA this quarter as they are heavily pushing deliveries to NA to meet year end goals. But otherwise it was seeming to hold steady where the whole world was roughly the same estimated wait time.
I also point toward the fact that Elon has stated before that their goal for wait times is for it to be measured "in weeks not months". This to me indicates that while wait times have dropped off, that this is just them letting things fall back some such that they are able to hit a more sweet spot in the wait times. As they up production, they will pull demand levers as necessary to keep the wait times at a happy spot.
But again, look at what they have done with this quarter and NA. They hit a point where they knew they couldn't get in anymore non-NA deliveries, so we are now full bore pushing NA deliveries like it is going out of style.
Also regarding the lack of CA registrations, it may be that Tesla has been pushing out Non-CA NA deliveries and queuing since they will likely leave their closest areas for December so they can dump as many cars on the market as possible. Just speculation, but I wouldn't read too much into low CA numbers for Nov, and I am willing to bet that the InsideEVs number is a pretty good estimate (keeping in mind that their number always includes Canada in it).�
Dec 3, 2015
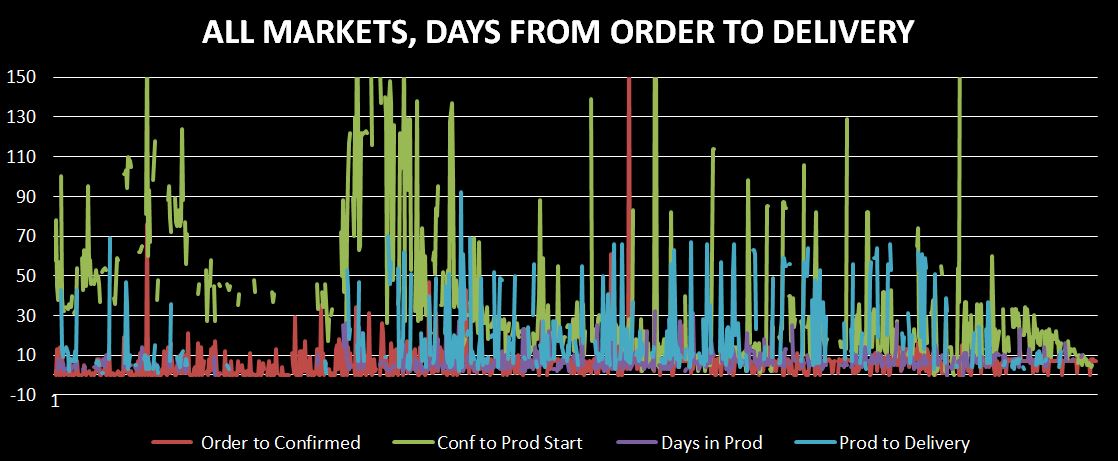
Auzie CE, I agree with your thinking along the lines of steady world wide demand for S. The pattern is visible on my chart up thread that shows all markets delays (days) plotted. Here is the chart again
If we disregard the graph tail (circled) as that tail is clearly US market only and most VINs on that part of the chart have not reported all delays (dates), it is evident that the confirmation to production start days are fairly constant in 2015. I will have another go at VIN data on weekend, clean it up a bit (remove incomplete data) and see what is visible on plots regarding world wide demand moves.
I also agree with the SA author that we can discern the demand movements (to a limited degree) from the charts. The insight on demand is greatly clouded with unknown production rate movements. Once production rate is known, we would be able to discern demand levels with more clarity from the VIN data doc.
Demand is not a fixed number, it can change any day in response to numerous developments. Tesla has control over some of these developments, like pricing, car improvements and similar, these are Tesla's demand levers.
There are some events outside of Tesla's control that affect demand, like forex moves, which is predictable for 2016 (unfavourable), regulatory developments related to ev in various countries (likely favourable but varies from country to country), general economic developments in various regions (favourable in some countries, neutral to unfavourable in most), etc.
If one gets a good estimation on the above and other not mentioned but relevant factors that affect demand, such estimation points to a path for shaping Tesla sales in various markets in 2016.�
Dec 8, 2015
chickensevil I would point out as far as Demand levers that they are still not fully pushed into the US yet (vast swaths of the US have little to no Tesla presence), and haven't pushed into other semi-key markets that at least influence their competitor's world wide sales numbers. We are seeing them push into Mexico and Korea here finally, but that still leaves countries like Dubai, India, and Russia largely left untouched (yes, I think some people have forcibly imported the car there, but that hardly counts.)
My guess is that they are trying to push out WW where it makes sense financially as they don't want to over extend themselves as far as OpEx but getting presence in a country sooner rather than later will also help them down the road with the Model 3 as the brand will be better known to the population.
Anyway, my point is that combined with the demand levers you mentioned it should not go unnoticed that they still don't have the global presence of even the likes of their competition and that is an important demand lever. On top of that, word of mouth is helpful to be sure, but advertising in a more traditional sense will help to get the word out to previously untouched individuals so we can add to the discovery factor of Tesla and lead the way to additional word of mouth spreading. Even in our area which is pretty Tesla friendly all around, I still get people who have never seen the car in person or are just not remotely aware of its existence. This is likely the reason for continued acceptance levels in places like CA, since there are likely plenty of people who might know vaguely of there being this EV made by a company called Tesla, they don't know much else and advertising would help penetrate that further should it be required. (The pop-up store is an example of trying to get the word out better, unsure how successful those were)�
Dec 9, 2015
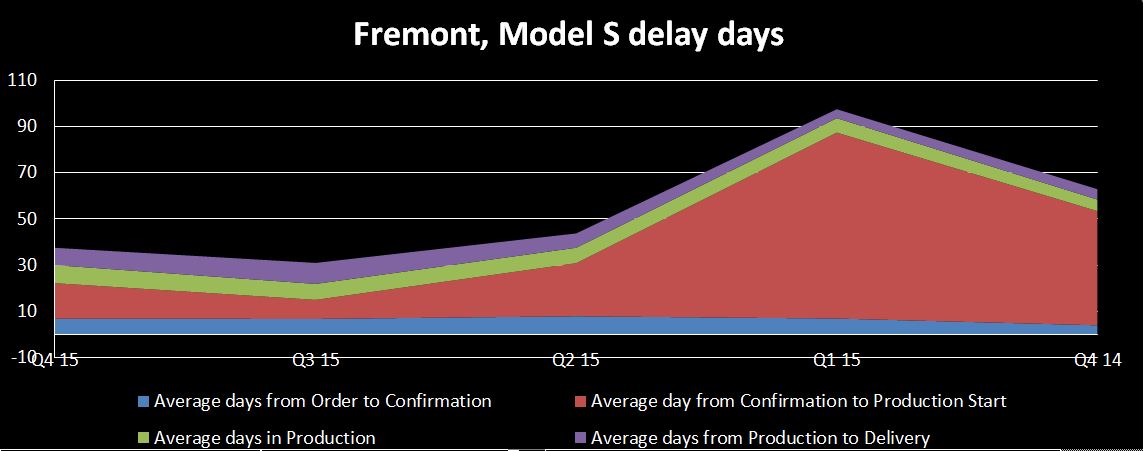
Auzie Couple of more graphs, based on google doc, Model S deliveries
Fremont deliveries, 5 last quarters
All cities deliveries, 5 last quarters
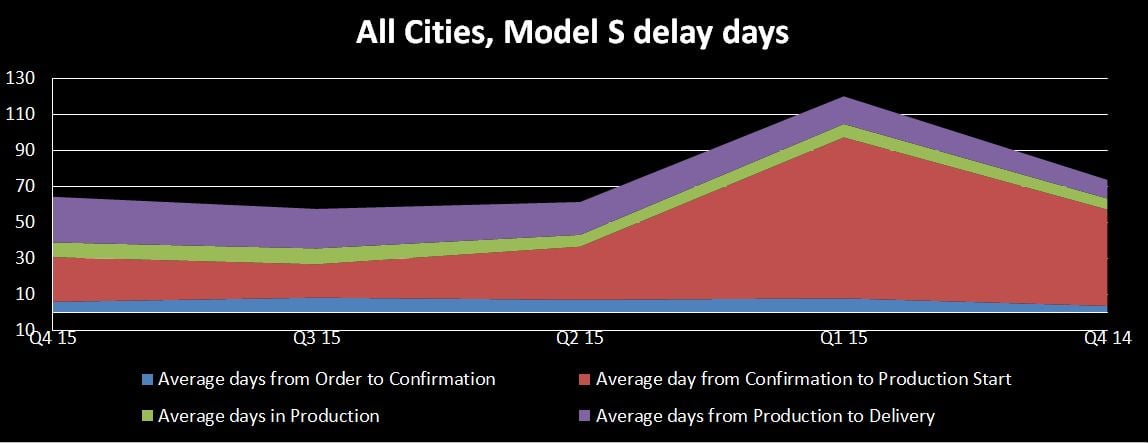
All cities Q4 15 delays are slightly shorter than Q4 14 delays. That slight shortening of delays is likely due to increased production rates in Q4 15 vs Q4 14.�
Dec 10, 2015
chickensevil Wow, you can tell when they switched from truck to rail that is really interesting. I also find it interesting that if anything there was a dip in Q3 and a slight rise in Q4 (at least based on the current Q4 data maybe it will come out as a wash by the end). This is a great sign of steady demand keeping up with obvious production increase. Although I'm sure that the referral program is a strong boost to those numbers. I would also strongly attribute them finally releasing autopilot as a demand boost. Those two factors have likely been two very strong levers in Tesla's sleeve to ensure a healthy demand level to keep up with production in Q4.�
Dec 10, 2015
Auzie Note the graphs use averaged numbers. I personally do not trust averages too much, they can be misleading sometimes.
Raw data is always the best information. Graphs of averages look neater than raw data graphs, that is the only advantage.
It will be interesting how the pattern unfolds in the coming quarters.�
Không có nhận xét nào:
Đăng nhận xét